Figures & data
Figure 1. Effect of 2-dihydroailanthone on U251 cell survival. Cells were treated with the different doses of 2-dihydroailanthone for 48 h. Cell survival was determined by MTT, *p < 0.05, **p < 0.01.
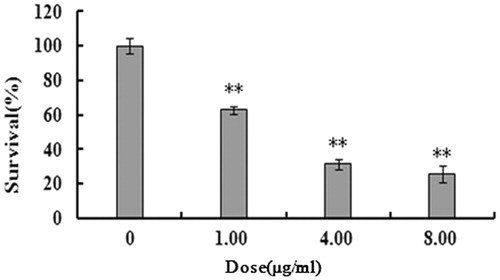
Figure 2. Effect of 2-dihydroailanthone on normal cells survival. Cells were treated with the dose of 20 μg/mL 2-dihydroailanthone for 48 h. Cell survival was determined by MTT, *p < 0.05, **p < 0.01.
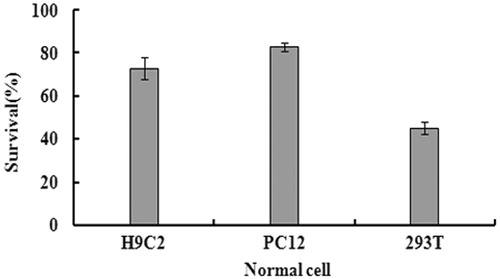
Figure 3. Apoptosis of U251 cells after treatment with different doses of 2-dihydroailanthone. U251 cells were treated with different doses of 2-dihydroailanthone for 48 h and measured by flow cytometry. (A) Control, (B) 1.50 μg/mL, (C) 3.00 μg/mL, (D) 5.80 μg/mL, (E) histogram of apoptosis of U251 cells, *p < 0.05, **p < 0.01 (n = 3).
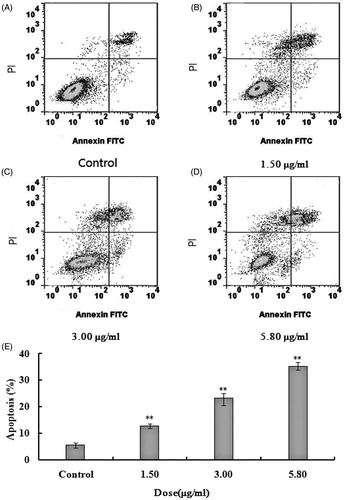
Figure 4. Cell cycle of U251 cells after treatment with different doses of 2-dihydroailanthone. U251 cells were treated with different doses of 2-dihydroailanthone for 48 h and the cell cycle were measured by flow cytometry. (A) Control, (B) 1.50 μg/mL, (C) 3.00 μg/mL, (D) 5.80 μg/mL, (E) histogram of cell cycle of U251 cells, *p < 0.05, **p < 0.01 (n = 3).
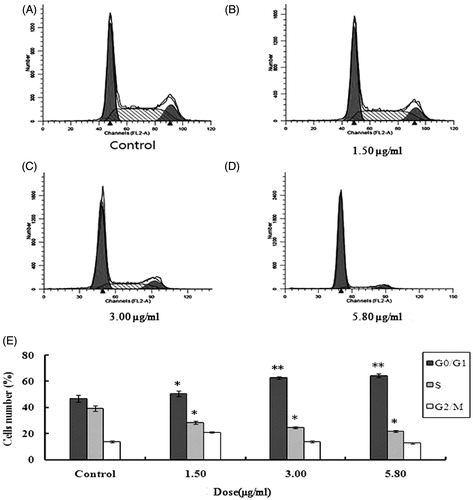
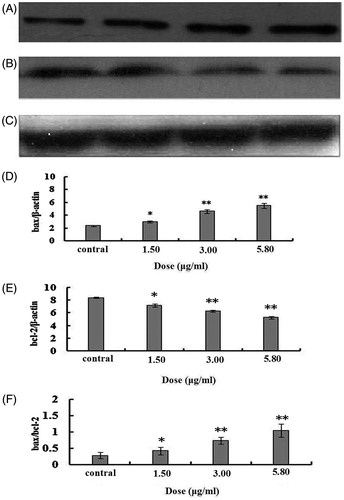
Figure 5. The bax/bcl2 mRNA in U251 cells after treatment with different doses of 2-dihydroailanthone. After 48 h treatment by different doses of 2-dihydroailanthone, bax/bcl2 mRNA in the U251 cells were measured by RT-PCR. (A) Bax, (B) bcl-2, (C) gapdh, (D) histogram of bax, (E) histogram of bcl-2, (F) histogram of bax/bcl-2 ratio, *p < 0.05, **p < 0.01 (n = 3).
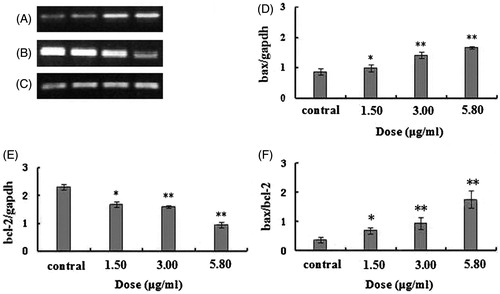
Figure 6. The bax/bcl2 proteins in U251 cells after treatment with different doses of 2-dihydroailanthone. After 48 h treatment by different doses of 2-dihydroailanthone, bax/bcl2 in the U251 cells were measured by Western blot, (A) bax, (B) bcl-2, (C) β-actin, (D) bax protein content of U251 cells in different doses of 2-dihydroailanthone, (E) bcl-2 protein content of U251 cells in different doses of 2-dihydroailanthone, (F) histogram of bax/bcl-2 ratio, *p < 0.05, **p < 0.01 (n = 3).