Figures & data
Figure 1. UV-HPLC chromatographic profile of nSA. The chromatograms were obtained at 260 nm. Lithospermoside (1); chlorogenic acid (2); ferulic acid (3).
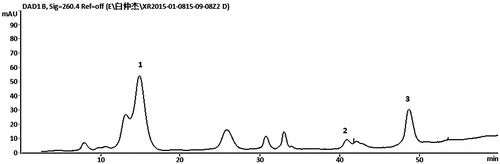
Figure 2. Effects of nSA on cell viability of H2O2-induced cell death in HLE cells. (A) HLE cells were incubated with different concentrations of nSA (62.5–2000 μg/mL) for 24 h. (B) HLE cells were incubated with different concentrations of H2O2 (50–500 μM) for 24 h. (C) HLE cells were preincubated with nSA (62.5–2000 μg/mL) for 2 h before the treatment with 250 μM H2O2 for 24 h. Cell viability was assessed by MTT assay. Data were expressed as mean ± SEM and were obtained from three independent experiments. ###p < 0.001, compared with the untreated control group; *p <0.05, **p <0.01 and ***p <0.001, compared with the H2O2-treated group.
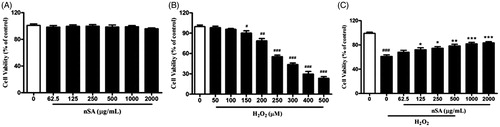
Figure 3. nSA prevented H2O2-induced cellular apoptosis in HLE cells. HLE cells were preincubated with nSA (250, 500 and 1000 μg/mL) for 2 h before the treatment with 250 μM H2O2 for 6 h. The apoptotic cells were stained with Annexin V-FITC and PI, and then detected by flow cytometry. Data were expressed as mean ± SEM and were obtained from three independent experiments. ###p <0.001, compared with the untreated control group; *p <0.05, **p <0.01 and ***p <0.001, compared with the H2O2-treated group.
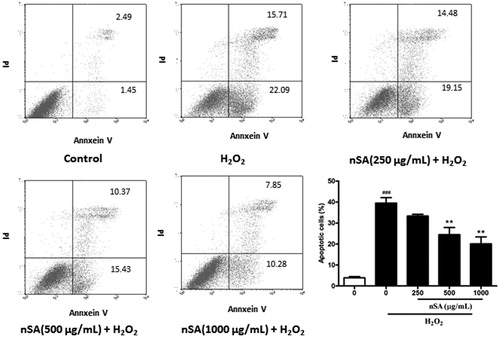
Figure 4. nSA inhibited H2O2-induced oxidative stress in HLE cells. HLE cells were preincubated with nSA (250, 500 and 1000 μg/mL) for 2 h before the treatment with 250 μM H2O2 for 24 h. Cells were lysed and then the levels of MDA (A), T-SOD (B), CAT (C), GSH-Px (D) and T-AOC (E) were measured using commercial assay kits. Data were expressed as mean ± SEM and were obtained from three independent experiments. ###p <0.001, compared with the untreated control group; *p <0.05, **p <0.01 and ***p <0.001, compared with the H2O2-treated group.
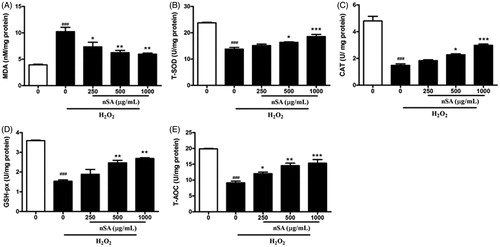
Figure 5. nSA inhibited H2O2-induced dissipation of Δψm in HLE cells. HLE cells were preincubated with nSA (250, 500 and 1000 μg/mL) for 2 h before the treatment with 250 μM H2O2 for 6 h. Cells were incubated with Rh123 (1 μM) for 30 min at 37 °C, and fluorescent intensity were analysed using flow cytometry. Data were expressed as mean ± SEM and were obtained from three independent experiments. #p <0.001, compared with the untreated control group; *p <0.05, **p <0.01 and ***p <0.001, compared with the H2O2-treated group.
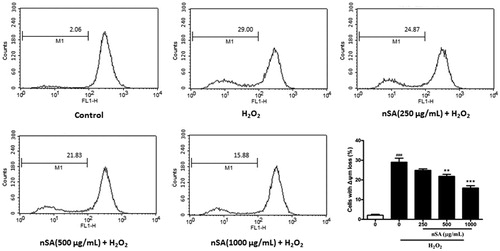
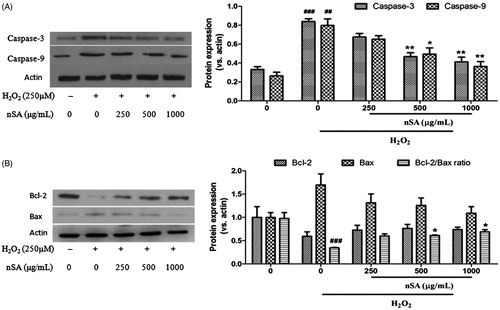
Figure 6. nSA suppressed the activation of caspase-3 and caspase-9 (A.) and restored the Bcl-2/Bax ratio (B.) in H2O2-induced HLE cells. HLE cells were preincubated with nSA (250, 500 and 1000 μg/mL) for 2 h before the treatment with 250 μM H2O2 for 24 h. Cells were lysed and the expression of caspase-3, caspase-9, Bcl-2 and Bax were evaluated using western blot analysis. Data were expressed as mean ± SEM and were obtained from three independent experiments. ###p <0.001, compared with the untreated control group; *p <0.05 and **p <0.01, compared with the H2O2-treated group.