Figures & data
Figure 1. Graphical presentations of serum biochemical estimations in different groups, where (A) rheumatoid factor (RF); (B) matrix metalloproteinase-3 (MMP-3); (C) cartilage oligomeric matrix protein (COMP); (D) Immunoglobulin G (IgG); (E) antinuclear antibody (ANA); (F) Tumour necrosis factor-alpha (TNF-α); (G) interleukin-10 (IL-10); (H) myeloperoxidase (MPO); (I) C-reactive protein (CRP); (J) malondialdehyde (MDA); (K) glutathione reduced (GSH). aSignificantly different from normal control group, bsignificantly different from arthritis control group, csignificantly different from methotrexate treatment group at p < 0.05.
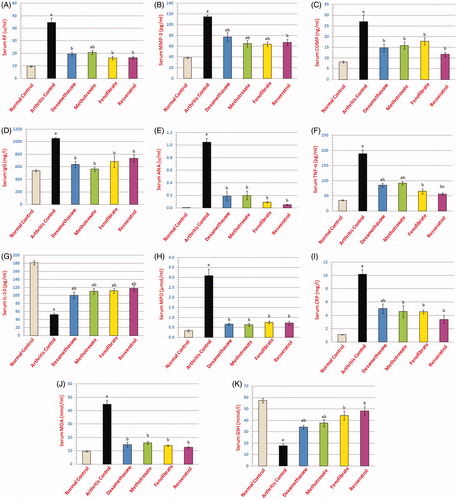
Figure 2. Photomicrographs of articular cartilages of different sections (H&E; 200×). Normal control rat section (top left) shows a smooth continuous articular surface (black arrow) and a regular tide mark (white arrow) separating the articular cartilage (C) from the underlying subchondral bone (D). Arthritis control rat section (top right) shows disrupted articular surface (black arrow) with chondrocytes showing degeneration with pyknotic nuclei (white arrow). Dexamethasone-treated arthritic rat section (middle left) shows smooth articular surface (black arrow) and thickened articular cartilage (C) and subchondral bone (D). The chondrocytes (white arrow) show hypercellularity and cloning, while regular tide mark can be seen (arrowhead). Methotrexate-treated arthritic rat section (middle right) shows smooth articular surface (black arrow) with thickened articular cartilage (C) and subchondral bone (D). The chondrocytes (white arrow) show hypercellularity and cloning, and regular tide mark can be seen (arrowhead). Fenofibrate-treated arthritic rat section (bottom left) shows a narrow area of disrupted articular surface (black arrow). Thickened articular cartilage (C) and subchondral bone (D) can be observed. Regular tide mark can also be observed (white arrow). Resveratrol-treated arthritic rat section (bottom right) shows a smooth articular surface (black arrow). The articular cartilage (C) shows hypercellularity and aggregation of chondrocytes (white arrow). Subchondral bone (B) can be observed.
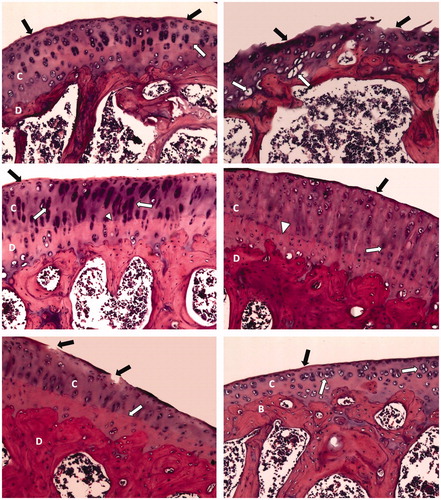
Figure 3. Photomicrographs of splenic parenchyma of different sections (H&E; 100×). Normal control rat section (top left) shows lymphatic follicles (W) named white pulp surrounded with red pulp (R). Lymphatic follicles show central arteriole (arrowhead) and well-defined marginal zone (white arrow). Trabeculae can be observed (black arrow). Arthritis control rat section (top right) shows atrophy of white pulp (W) and red pulp (R). Dexamethasone-treated arthritic rat section (middle left) shows lymphatic follicles (W) named white pulp surrounded with red pulp (R). Lymphatic follicles show central arteriole (arrowhead) and well-defined marginal zone (white arrow). Trabeculae can be observed (black arrow). Methotrexate-treated arthritic rat section (middle right) shows slight atrophy of white pulp (W) with the appearance of many foamy cells (black arrow) within red pulp (R). Fenofibrate-treated arthritic rat section (bottom left) shows lymphatic follicles (W) named white pulp surrounded with red pulp (R). Lymphatic follicles show central arteriole (arrowhead) and well-defined marginal zone (white arrow). Resveratrol-treated arthritic rat section (bottom right) shows normal white pulp (W) and atrophic red pulp (R).
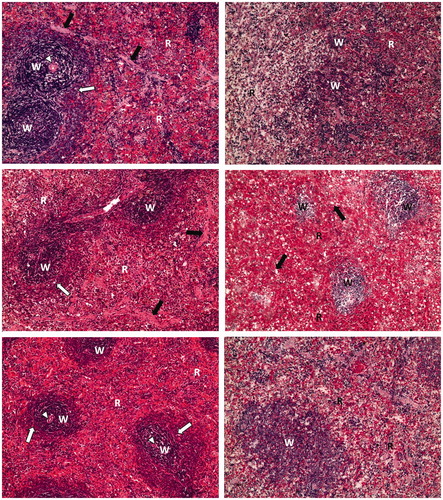
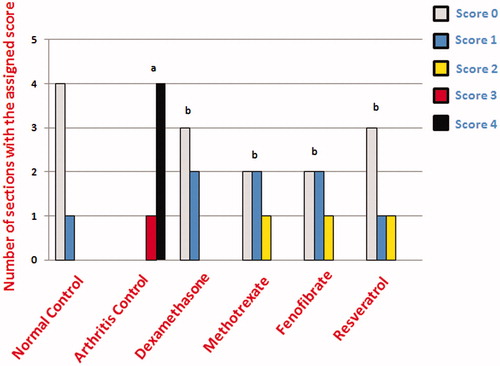
Figure 4. Joint cartilage erosion score counts. aSignificantly different from normal control group, bsignificantly different from arthritis control group at p < 0.05.