Figures & data
Table 1. Time course of blood glucose level in normal, glibenclamide and EFSD administered rats during oral glucose tolerance test.
Figure 1. Changes in the feed (g) and water (ml) intake, where plotted values represents mean ± SEM of feed (g) and water (ml) intake, in which acomparison of disease control (STZ + NA) versus normal control, bcomparison of treated group versus disease control (STZ + NA). The level of significance: *p < 0.05.
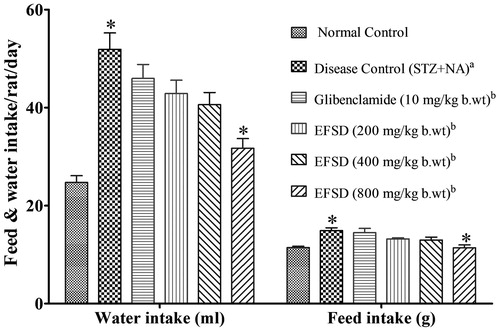
Table 2. Effect of EFSD in the body weight, urine level, HbA1c and Hb.
Figure 2. Effect of EFSD on BGL in diabetic rats, where plotted values are mean ± SEM, in which acomparison of disease control (STZ + NA) versus normal control, bcomparison of treated group versus disease control (STZ + NA). The level of significance: **p < 0.01.
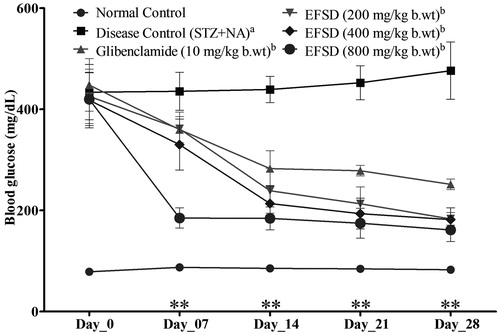
Table 3. Effect of EFSD in renal function parameters: urea, uric acid and CR levels.
Table 4. Effect of EFSD in lipid profiles: TC, HDL-C and TG.
Figure 3. Changes in the liver glycogen level after the treatment of EFSD in various concentrations, where plotted values are mean ± SEM of liver glycogen of normal control group, disease control (STZ + NA) group, glibenclamide treated group (10 mg/kg b.wt), EFSD (200, 400 and 800 mg/kg b.wt) treated groups, in which acomparison of disease control (STZ + NA) versus normal control, bcomparison of treated group versus disease control (STZ + NA). The level of significance: **p < 0.01; ***p < 0.001.
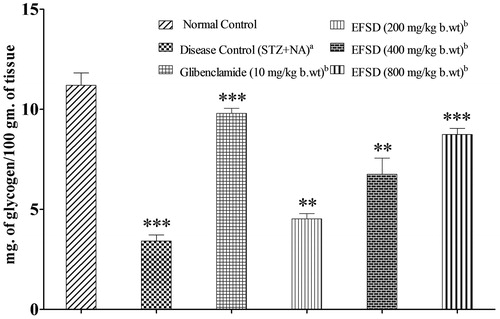
Figure 4. Changes in the total protein after the treatment in all experimental groups, where plotted values are mean ± SEM of total protein concentration, in which acomparison of disease control (STZ + NA) versus normal control, bcomparison of treated group versus disease control (STZ + NA). The level of significance: *p < 0.05.
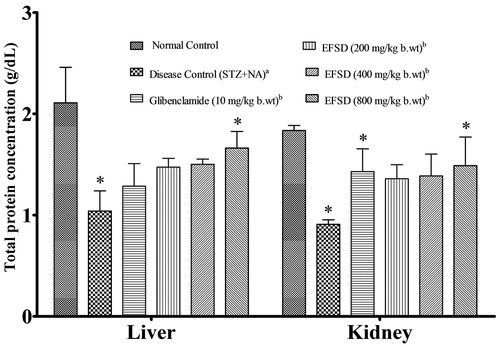
Table 5. Effect of EFSD in the oxidative markers: LPO, SOD, CAT, GSH and Vit-C.
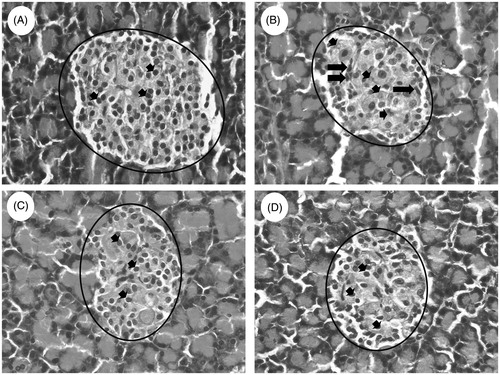
Figure 5. Histopathology analysis of pancreas (Magnification HE. 40×), it illustrates (A) normal Islets of Langerhans with granulated cytoplasm and acini tissues in normal rat, (B) irregular necrotic pancreatic acini (marked with circle) and cytoplasmic degeneration (short arrow) also irregular outlining (long arrow) in the STZ − NA-induced disease control (STZ + NA) and (C) glibenclamide treated and (D) EFSD (800 mg/kg b.wt) treated shows restoration in the islets of Langerhans (short arrow) and regular lining of pancreatic acini around the Langerhans (marked with circle).