Figures & data
Figure 1. Structures of the isolated compounds of M. styphelioides.
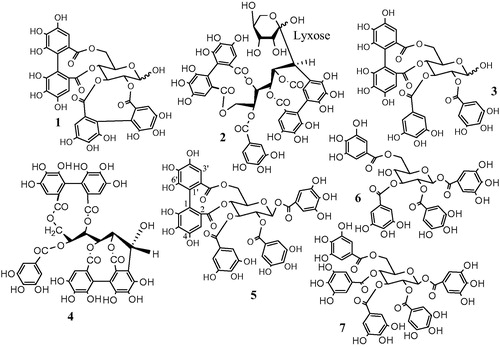
Figure 2. Effect of pretreatment with isolated compounds, extract (MSE) and silymarin (Sil) on the ALT leakage from HepG2 cells challenged with CCl4. Data are expressed as the mean ± SEM, (n = 3). The experiment was done in triplicates. MSE and silymarin were tested in three concentrations (100, 50, 25 μg/ml). The isolated compounds were tested in three concentrations (100, 50, 25 μm). **p < 0.01 and ***p < 0.001; significantly different compared to the normal control group. ###p < 0.001; significantly different compared to the CCl4-treated group. $p < 0.05, $$p < 0.01 and $$$p < 0.001; significantly different compared to the silymarin-treated group. (Pedun, pedunculagin; Ptero, pterocarinin A; Tellim I, tellimagrandin I; Casuar, casuarinin; Tellim II, tellimagrandin II; TGG, tetragalloylglucose; PGG, pentagalloyl glucose).
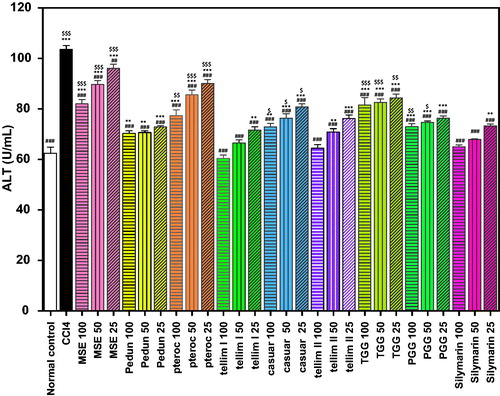
Figure 3. Effect of pretreatment with isolated compounds, extract (MSE) and silymarin (Sil) on the AST leakage from HepG2 cells challenged with CCl4. Data are expressed as the mean ± SEM, (n = 3). The experiment was done in triplicates. MSE and silymarin were tested in three concentrations (100, 50, 25 μg/ml). The isolated compounds were tested in three concentrations (100, 50, 25 μm). *p < 0.05, **p < 0.01 and ***p < 0.001; significantly different compared to the normal control group. ###p < 0.001; significantly different compared to the CCl4-treated group. $p < 0.05 and $$$p < 0.001; significantly different compared to the silymarin-treated group. (Pedun, pedunculagin; Ptero, pterocarinin A; Tellim I, tellimagrandin I; Casuar, casuarinin; Tellim II, tellimagrandin II; TGG, tetragalloylglucose; PGG, pentagalloyl glucose).
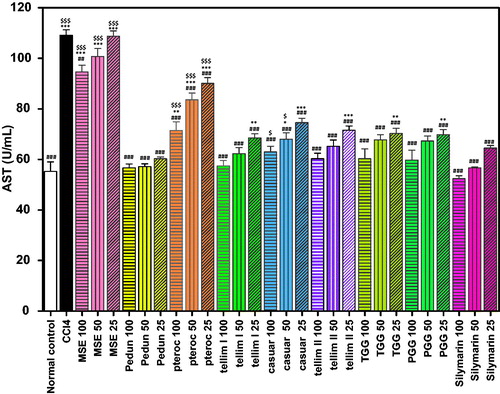
Figure 4. Effect of pretreatment with isolated compounds, extract (MSE) and silymarin (Sil) on GSH level in HepG2 cell lysate. Data are expressed as the mean ± SEM, (n = 3). The experiment was done in triplicates. MSE and silymarin were tested in three concentrations (100, 50, 25 μg/ml). The isolated compounds were tested in three concentrations (100, 50, 25 μm). **p < 0.01 and ***p < 0.001; significantly different compared to the normal control group. #p < 0.05, ##p < 0.01 and ###p < 0.001; significantly different compared to the CCl4-treated group. $$$p < 0.001; significantly different compared to the silymarin-treated group. (Pedun, pedunculagin; Ptero, pterocarinin A; Tellim I, tellimagrandin I; Casuar, casuarinin; Tellim II, tellimagrandin II; TGG, tetragalloylglucose; PGG, pentagalloyl glucose).
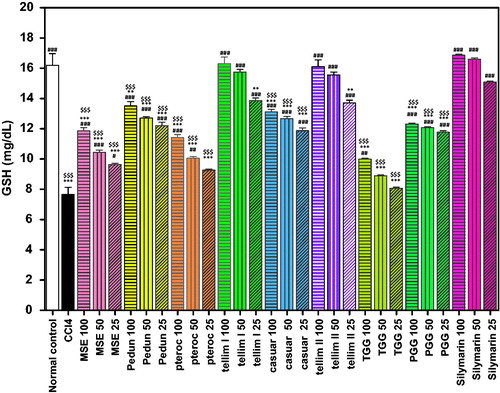
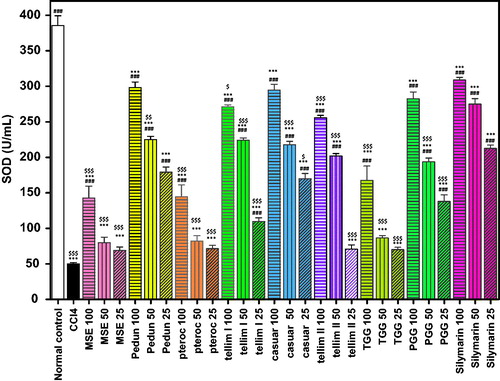
Figure 5. Effect of pretreatment with isolated compounds, extract (MSE) and silymarin (Sil) on SOD activity in HepG2 cell lysate. Data are expressed as the mean ± SEM, (n = 3). The experiment was done in triplicates. MSE and silymarin were tested in three concentrations (100, 50, 25 μg/ml). The isolated compounds were tested in three concentrations (100, 50, 25 μm). ***p < 0.001; significantly different compared to the normal control group. ###p < 0.001; significantly different compared to the CCl4-treated group. $p < 0.05, $$p < 0.01 and $$$p < 0.001; significantly different compared to the silymarin-treated group. (Pedun, pedunculagin; Ptero, pterocarinin A; Tellim I, tellimagrandin I; Casuar, casuarinin; Tellim II, tellimagrandin II; TGG, tetragalloylglucose; PGG, pentagalloyl glucose).