Figures & data
Figure 1. The chemical structure of puerarin 6″-O-xyloside (POS).
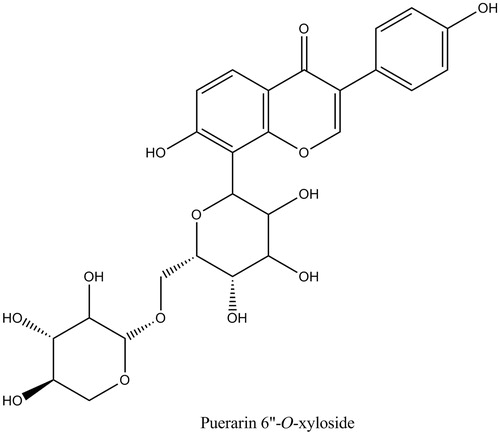
Figure 2. Anti-proliferative effect of puerarin 6″-O-xyloside (POS) on A549 cells in vitro. A549 cell lines were treated with POS (10, 20 and 40 μM) for 32 h, and cell proliferation was determined by the 3-(4, 5-dimethylthiazol-2-yl)-2, 5-diphenyltetrazolium bromide (MTT) assay. The data are represented as the mean ± SD (n = 4). *p < 0.05 and **p < 0.01 versus control.
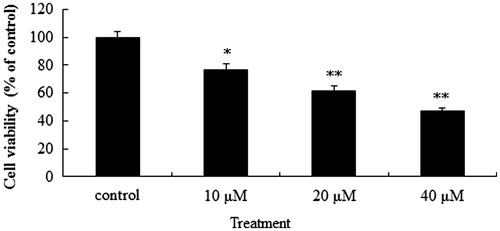
Figure 3. Flow cytometric analysis of A549 cells apoptosis following exposure to puerarin 6″-O-xyloside (POS). A549 cell lines were treated POS (10, 20 and 40 μM) for 32 h. The flow cytometry assay was performed to determine the apoptosis rate by Annexin-V/PI double-staining. (A–D) The control, 10, 20 and 40 μM groups.
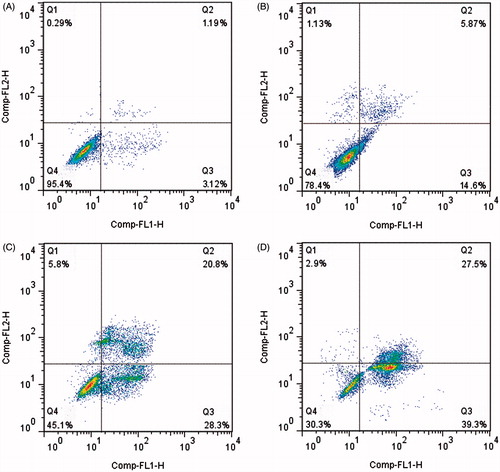
Figure 4. Effects of puerarin 6″-O-xyloside (POS) on the expressions of cytochrome c (cytoplasm and mitochondria) in A549 cells. Cytochrome c (C) and cytochrome c (M) represent the expressions of cytochrome c in the cytoplasm and mitochondria, respectively. A549 cell lines were treated POS (10, 20 and 40 μM) for 32 h, and the levels of the different proteins were measured by western blotting. The data are represented as mean ± SD (n = 4). *p < 0.05 and **p < 0.01 versus control.
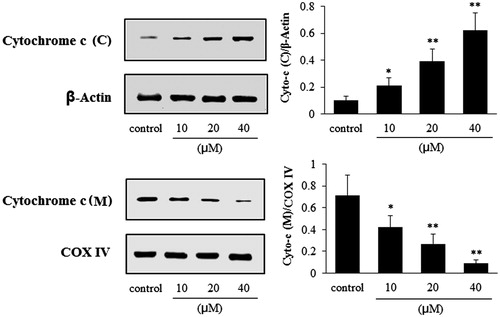
Figure 5. Effects of puerarin 6″-O-xyloside (POS) on the expressions of cleaved-caspase-3 (C-capase-3), cleaved-caspase-7 (C-capase-7) and cleaved-caspase-9 (C-caspase-9) in A549 cells. A549 cell lines were treated POS (10, 20 and 40 μM) for 32 h, and the levels of the different proteins were measured by western blotting. The data are represented as the mean ± SD (n = 4). *p < 0.05 and **p < 0.01 versus control.
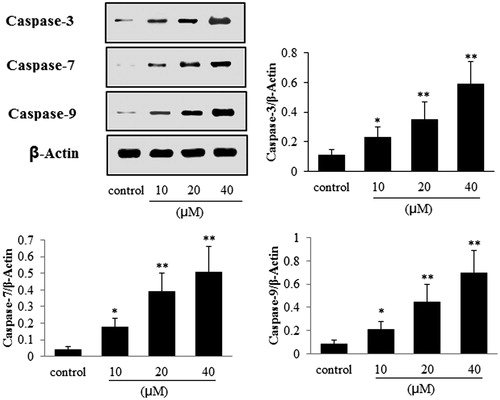
Figure 6. Effects of puerarin 6″-O-xyloside (POS) on the expressions of Bax and Bcl-2 in A549 cells. A549 cell lines were treated with POS (10, 20 and 40 μM) for 32 h, and the levels of the different proteins were measured by western blotting. The data are represented as the mean ± SD (n = 4). *p < 0.05 and **p < 0.01 versus control.
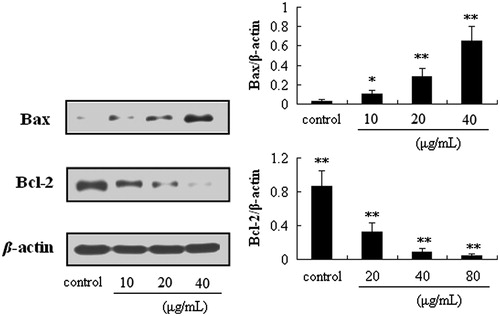
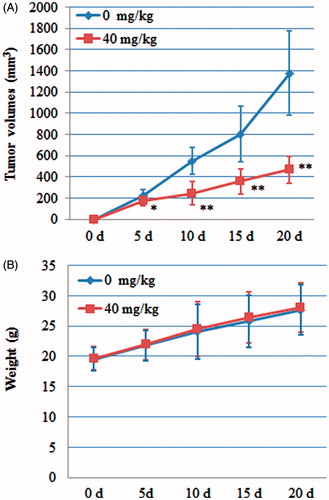
Figure 7. Antitumour activity of puerarin 6″-O-xyloside (POS) on A549 tumour-bearing nude mice. (A) Effect of POS on tumour volumes; (B) effect of POS on the weights of A549 tumour-bearing nude mice. The data are represented as the mean ± SD (n = 10). *p < 0.05 and **p < 0.01 versus control.