Figures & data
Figure 1. Molecular structure of hydroxysafflor-yellow A.
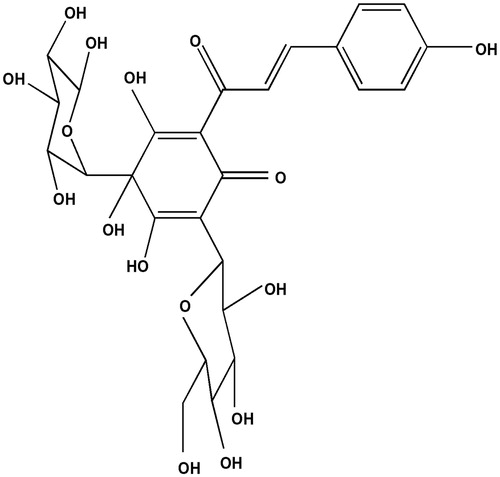
Table 1. Primer sequences for real-time quantitative PCR.
Figure 2. The figure of HUVEC cells. HUVEC were stimulated with factor VIII, and the related antigen-antibody complexes had red-brown precipitate in the cytoplasm (× 40 magnification).
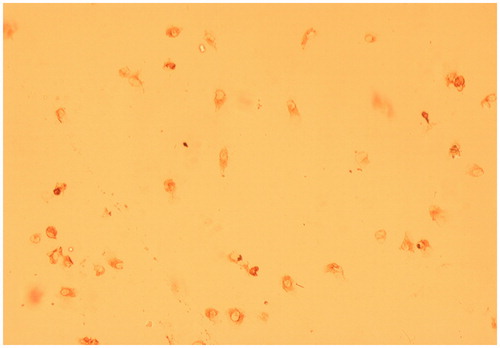
Figure 3. mRNA and protein expression of HUVEC VEGF and KDR in each group. Note: compared with the control group, **p <0.01; compared with the TCCS group, #p <0.05, ##p <0.01.
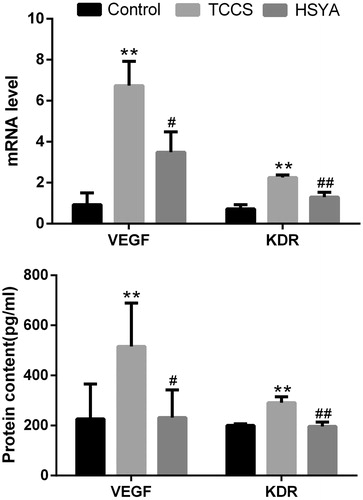
Figure 4. Expression level of bFGF in HUVEC cell culture supernatant treated with HSYA. Note: compared with the control group, *p < 0.05, **p < 0.01.
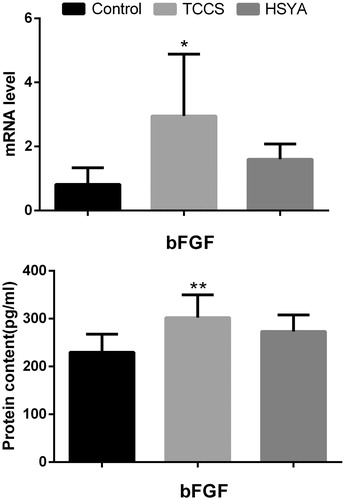
Figure 5. Expression level of related molecules in the ERK pathway of HUVECs. Of the three protein band patterns on each gel, the control group (left), tumour cell culture supernatant-induced group (middle) and the HSYA-treated group (right) are shown.
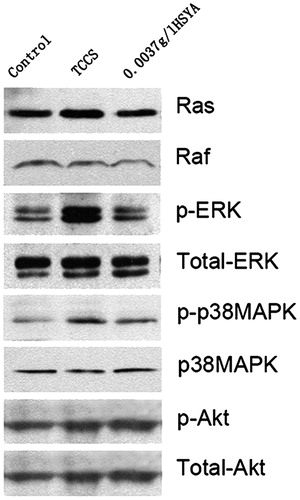
Figure 6. The mRNA expression of c-myc, N-ras and NF-κB1 in the tumour cell culture supernatant-induced HUVEC. Note: compared with the control group, *p < 0.05, **p < 0.01; compared with the TCCS group, #p < 0.05, ##p < 0.01.
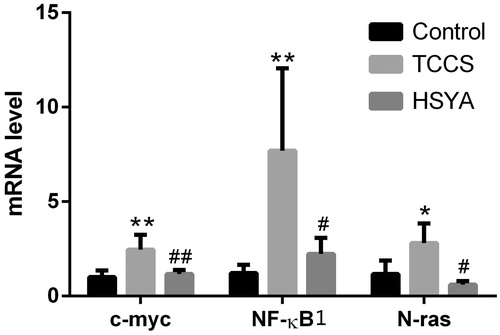
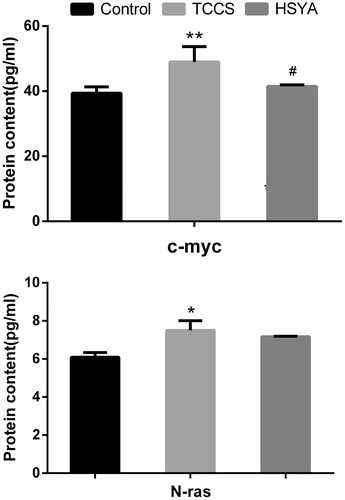
Figure 7. Content in cell lysates of c-myc and N-ras in the tumour cell culture supernatant-induced HUVEC. Note: compared with the control group, *p < 0.05; compared with the TCCS group, #p < 0.05.