Figures & data
Table 1. Effect of Rg1 on the kidney function of d-galactose model mice (x ± s, n = 10).
Figure 1. Effect of Rg1 on the kidney structure of d-galactose model mice (HE stain, ×100). ▴: glomerulus.
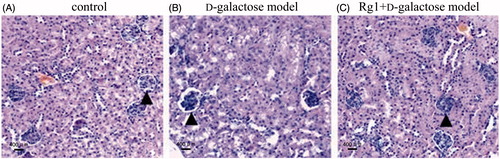
Figure 2. Effect of Rg1 on the structure of kidney glomerulus of d-galactose model mice (HE stain, ×400). ![]()
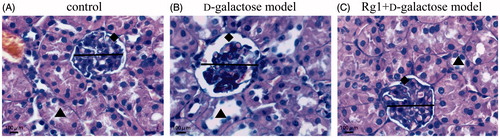
Table 2. Effect of Rg1 on the structure of glomerulus of d-galactose model mice (x ± s, n = 10).
Figure 3. Effect of Rg1 on the kidney cells senescence of d-galactose model mice (SA-β-Gal stain × 400).
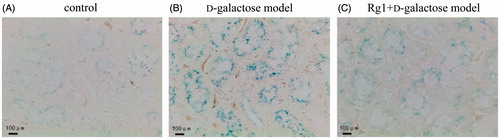
Table 3. Effect of Rg1 on the SA-β-gal staining of d-galactose model mice (x ± s, n = 10).
Figure 4. Effect of Rg1 on the ultrastructure of glomerulus of d-galactose model mice.
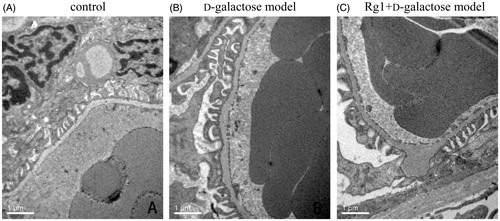
Table 4. Effect of Rg1 on the thickness of glomerulus basement membrane and slit of podocyte of d-galactose model mice (x ± s, n = 10).
Table 5. Effect of Rg1 on the level of SOD, MDA and GSH-PX in the kidney of d-galactose model mice (x ± s, n = 10).
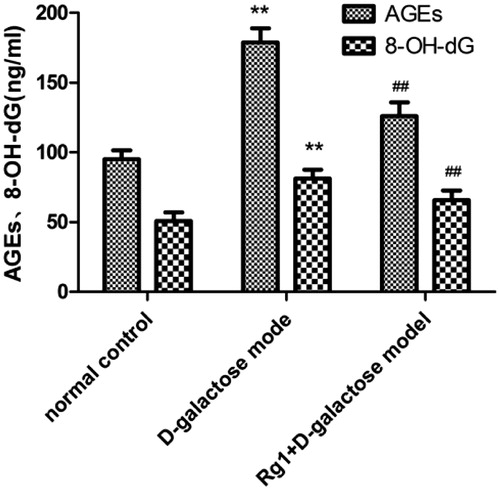
Figure 5. Effect of Rg1 on 8-OH-dG and AGEs in the kidney of d-galactose model mice. *p < 0.05, **p < 0.01 compared with the normal group, #p < 0.05, ##p < 0.01 compared with d-galactose.