
Figures & data
Table 1. Effect of the CFAE on castor oil-induced diarrhoea in mice.
Table 2. Effect of the CFAE on gastrointestinal motility in mice.
Table 3. Effect of the CFAE on castor oil-induced enteropooling in rats.
Figure 1. Small intestine sections of mice treated with PSS + castor oil (A), CFAE + castor oil (B) and PSS + PSS (C).
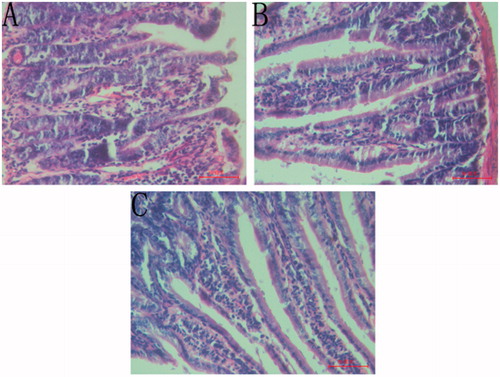
Figure 2. Liver sections of mice treated with PSS + castor oil (A), CFAE + castor oil (B) and PSS + PSS (C).
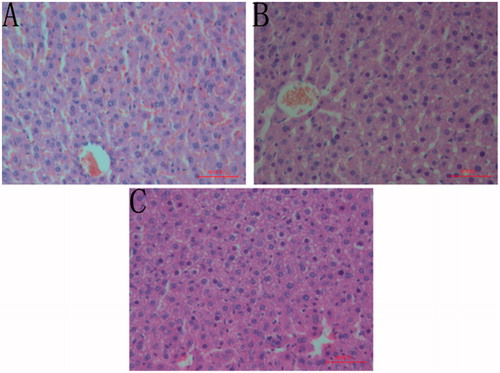
Table 4. Effect of the CFAE on castor oil-induced diarrhoea in mice.
Figure 3. The MS spectra of four representative compounds in the ethyl acetate fraction of CFAE: (1A and 1B) gallic acid; (2A and 2B) 3,4,6-tri-O-galloyl-β-d-Glc; (3A and 3B) corilagin; (4A and 4B) ellagic acid.
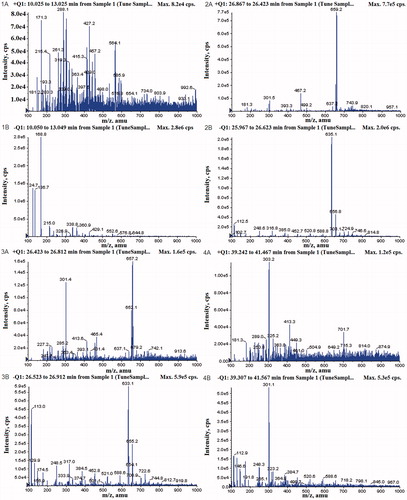
Figure 4. Representative HPLC chromatograms of (A) the ethyl acetate fraction of the CFAE; (B) mixed standard solutions. (1) Gallic acid; (2) 3,4,6-tri-O-galloyl-β-d-Glc; (3) corilagin; (5) ellagic acid. The HPLC analytical conditions were described in the Analysis of the main compounds in ethyl acetate fraction section.
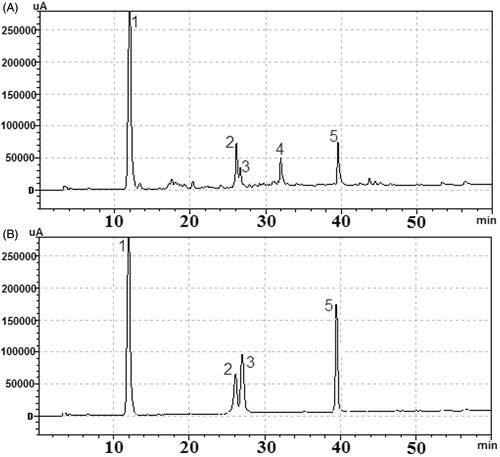
Table 5. HPLC-ESI-MS fragmentation (negative and positive ion modes) and UV–vis absorption data of the compounds detected in the ethyl acetate fraction of the CFAE.