Figures & data
Figure 1. HPLC analysis of the plant extract reveals a complex composition of DZW water extract (Table 1).
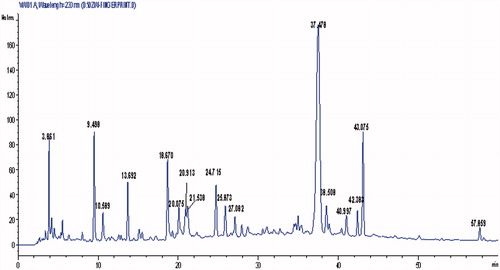
Table 1. Characterization of DZW water extract compounds from HPLC chromatogram.
Table 2. Body weight and uterus wet weight, serum parameters after 12 weeks administration of DZW (n = 10, mean ± SD).
Table 3. BMD, Micro-CT properties of femoral trabeculae and biomechanical test of femur after 12 weeks administration of DZW (n = 10, mean ± SD).
Figure 2. Representative Micro-CT images of trabecular bone microarchitecture in the distal femurs. (a) SHAM group, (b) OVX group, (c) E2 group, (d) DZW-L group, (e) DZW-M group and (f) DZW-H group. The OVX rats presented notable reduction in the trabecular number, trabecular area compared with the SHAM rats. DZW and E2 partially prevented OVX-induced trabecular bone loss and significantly improved trabecular bone mass and microarchitecture.
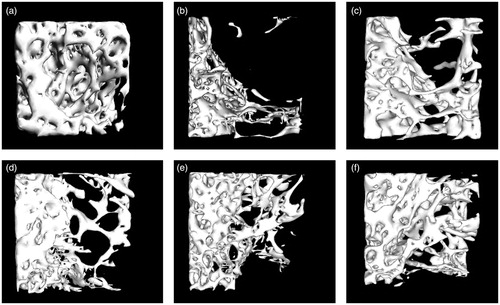
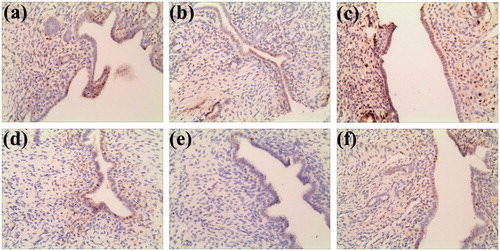
Figure 3. Representative ER expression of uterus in the endometrium. (a) SHAM group, (b) OVX group, (c) E2 group, (d) DZW-L group, (e) DZW-M group and (f) DZW-H group. The OVX rats presented notable reduction of ER labelling compared with the SHAM rats. DZW and E2 partially prevented OVX-induced ER expression reduction.