Figures & data
Figure 1. ATRA-induced differentiation of SH-SY5Y cells. (A) Representative morphological images of undifferentiated and differentiated SH-SY5Y cells. (B) Change in the axonal length of the cells. (C) Bar graph representing the percentage of differentiated cells relative to the total number of cells counted and summarized. At least 500 cells were counted per parallel hole. (D) Protein levels of NeuN and GFAP in undifferentiated and differentiated SH-SY5Y cells were detected by Western blot analysis. Data are shown as mean ± SD, n = 6, **p < 0.01 versus the normal group as measured by unpaired Student’s t-tests.
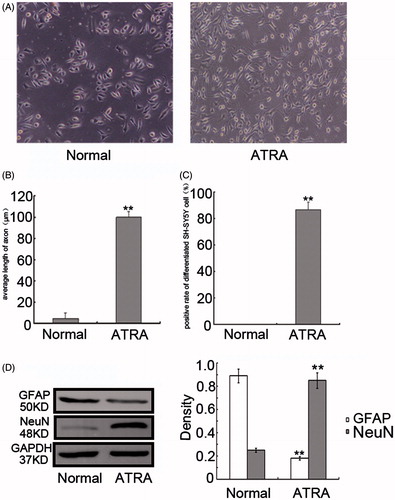
Figure 2. Growth curve of the differentiated SH-SY5Y cells treated with different SMND-309 concentrations. Data are shown as mean ± SD, n = 6, *p < 0.05 versus the control group as measured by unpaired Student’s t-tests.
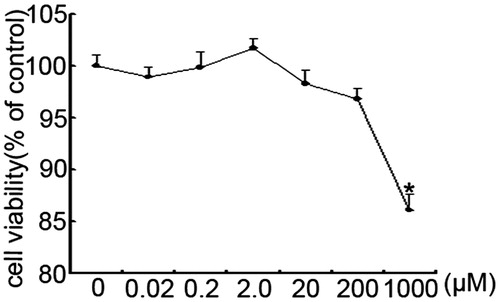
Figure 3. Attenuation of OGD/R-induced cytotoxicity in differentiated SH-SY5Y cells by SMND-309. (A) SMND-309 increased the viability of the OGD/R-injured differentiated SH-SY5Y cells. (B) LDH release by differentiated SH-SY5Y cells was detected by LDH leakage assay. Data are shown as mean ± SD, n = 6, **p < 0.01 versus the control group; #p < 0.05 and ##p < 0.01 versus the model group as measured by the Student–Newman–Keuls test.
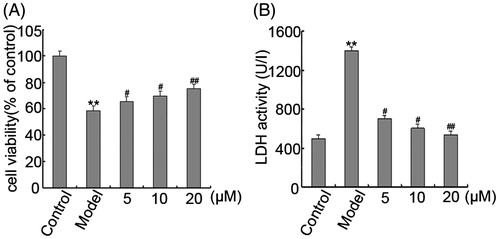
Figure 4. Inhibition of OGD/R-mediated apoptosis in differentiated SH-SY5Y cells by SMND-309. (A) SMND-309 reduced the apoptosis rate of differentiated SH-SY5Y cells as determined by Annexin V-FITC/PI assay. (B) SMND-309 inhibited the activity of caspase-3. (C) Immunoblot analysis highlighted the changes in the expression of apoptotic proteins Bcl2 and Bax. Data are shown as mean ± SD, n = 6, **p < 0.01 versus the control group; #p < 0.05 and ##p < 0.01 versus the OGD/R group; △p < 0.05, △△p < 0.01 versus the OGD/R + SMND-309 group as measured by the Student–Newman–Keuls test.
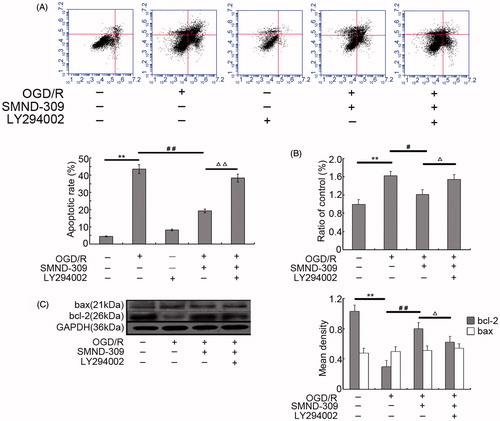
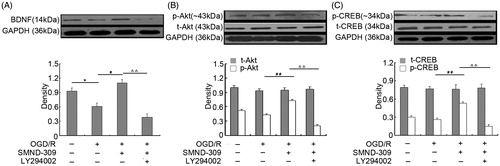
Figure 5. Modulation of SMND-309 on PI3K pathway-related proteins with or without LY294002. (A) Representative immunoblot of the protein levels of BDNF in OGD/R-injured differentiated SH-SY5Y cells treated with SMND-309 with or without LY294002. (B) Immunoblot result of the protein levels of Akt and p-Akt. (C) Protein levels of CREB and p-CREB. Quantification analysis results are also presented. Data are shown as mean ± SD, n = 6, *p < 0.05 versus the control group; #p < 0.05 and ##p < 0.01 versus the OGD/R group; △△p < 0.01 versus the OGD/R + SMND-309 group as measured by the Student–Newman–Keuls test.