
Figures & data
Table 1. Response of explants of C. roseus cultivars infected with Agrobacterium rhizogenes strains A4 and AR15834 after different co-cultured period.
Figure 1. Morphology of induced hairy roots. (A and B) Induction of hairy root on the wounded site of explants after the 30th day of culture in half-strength B5 semi-solid medium; (C, D and E) the selected hairy root lines; (F, G and H) growth of the LP10 hairy roots line after the 14th, 29th and 32nd days of culture in half-strength B5 liquid medium, respectively.
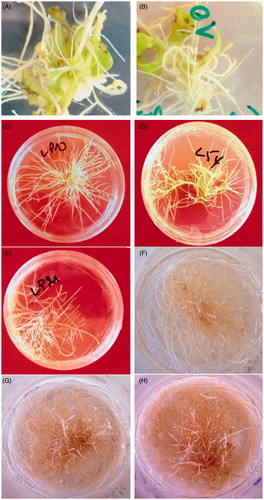
Table 2. Variation of growth index in selected hairy root lines after 20 d of culture in half-strength B5 liquid medium.
Figure 2. PCR amplification of rolB gene in hairy root lines of C. roseus. Lane M, molecular weight marker (1000 bp ladder); lane 1, DNA from non-transformed roots; lane 2, DNA from the plasmid A4 (positive control (1); lane 3, DNA from the plasmid 15834 (positive control (2); lane 4, DNA from HR line L54; lane 5, DNA from HR line LP21; lane 6, DNA from HR line LP10.
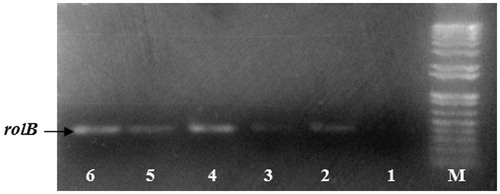
Figure 3. Dry weight accumulation kinetics in three selected hairy root lines.
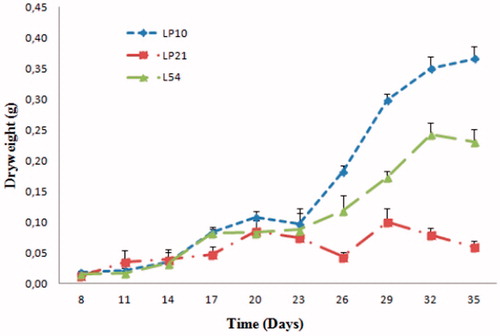
Figure 4. Evolution of the catharanthine accumulation in the three selected hairy root lines of C. roseus.
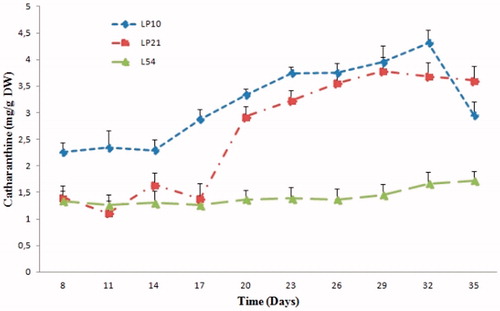
Figure 5. Evolution of ajmalicine accumulation in three selected hairy root lines in C. roseus.
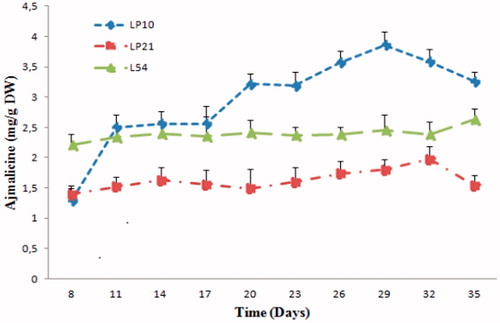
Figure 6. LCMS/MS of the alkaloids of methanolic extract of Catharanthus roseus roots. (A and B) Single ion chromatogram (SIC) of catharanthine [M + H]+parent ion (m/z = 143.50–144.50 + 172.50–173.50) and ajmalicine [M + H]+parent ion (m/z = 143.50–144.50 + 177.50–178.50 + 209.50–210.50 + 221.50–222.50), respectively. (C and D) MS spectrum of catharanthine and ajmalicine, respectively. (E and F) MS2 spectrum of catharanthine and ajmalicine, respectively.
![Figure 6. LCMS/MS of the alkaloids of methanolic extract of Catharanthus roseus roots. (A and B) Single ion chromatogram (SIC) of catharanthine [M + H]+parent ion (m/z = 143.50–144.50 + 172.50–173.50) and ajmalicine [M + H]+parent ion (m/z = 143.50–144.50 + 177.50–178.50 + 209.50–210.50 + 221.50–222.50), respectively. (C and D) MS spectrum of catharanthine and ajmalicine, respectively. (E and F) MS2 spectrum of catharanthine and ajmalicine, respectively.](/cms/asset/4b2f9d74-ee24-4e32-b16e-1619cf3c5149/iphb_a_1140213_f0006_b.jpg)
Table 3. Relationship between biomass growth and alkaloids accumulation of the three selected lines in C. roseus.