Figures & data
Table 1. Experimental protocols in the eight nephrotoxicity groups.
Table 2. Effects of NS treatments on changes in paracetamol-induced nephrotoxicity in rats.
Table 3. Effects of NS treatments on tissue SOD activity and GSH and MDA levels in paracetamol-induced nephrotoxicity in rats.
Figure 1. Histopathological score differences in groups. *Indicates that histopathological score significantly greater than the sham group, #indicates that histopathological score is significantly lower than the paracetamol 2 g/kg group, p < 0.05 was considered statistically significant.
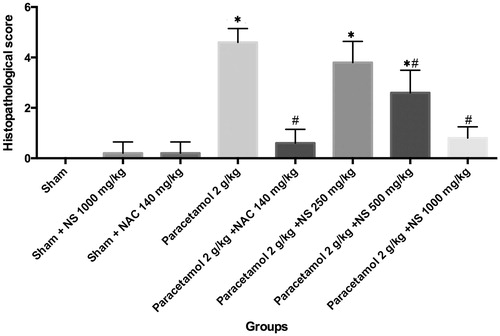
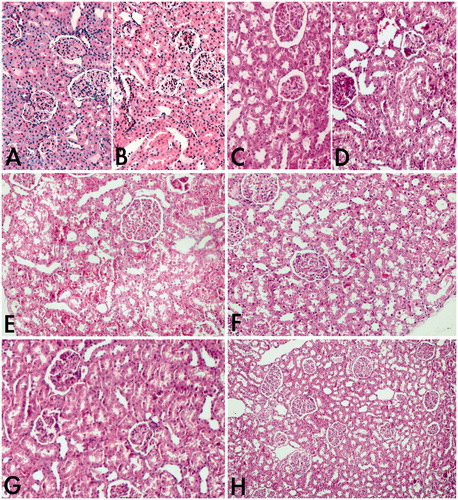
Figure 2. (A) Normal structure of kidney in control group. Haematoxylin and eosin. Magnification 200×. (B) Stained sections of kidney of sham + NS 1000 mg/kg group. Slight degenerations were seen. Haematoxylin and eosin. Magnification 200×. (C) Stained sections of kidney of sham + NAC 140 mg/kg group. Similar appearance to the control group. Haematoxylin and eosin. Magnification 200×. (D) Stained sections of kidney of paracetamol 2 g/kg + NS 250 mg/kg group. Haematoxylin and eosin. Magnification 200×. (E) Paracetamol-administered rat kidney. Severe necrosis, congestion and extravasation of red blood cells were seen. Haematoxylin and eosin. Magnification 200×. (F) Stained sections of kidney of paracetamol 2 g/kg + NS 500 mg/kg. Slightly to mild degenerations were seen. Haematoxylin and eosin. Magnification 200×. (G) Paracetamol 2 g/kg + NAC 140 mg/kg group. Structures of kidney were similar to the control group. Haematoxylin and eosin. Magnification 200×. (H) Paracetamol 2 g/kg + NS 1000 mg/kg group. Structures of kidney were similar to the control group. Haematoxylin and eosin. Magnification 100×.