Figures & data
Figure 1. Effect of CSE on the first (panel A) and the second phase (panel B) of BAV-induced nociception in mice. BAVCSE 1:6: BAV + 1.25 mg CSE/kg/50 μl PBS; BAVCSE 1:12: BAV + 2.5 mg CSE/kg/50 μl PBS; BAVCSE 1:25: BAV + 5.0 mg CSE/kg/50 μl PBS; BAVCSE 1:37: BAV + 7.5 mg CSE/kg/50 μl PBS; BAVCSE 1:50: BAV + 10 mg CSE/kg/50 μl PBS. The results are presented as mean ± SEM for five animals. Differences between BAVCSE groups and BAV group were analyzed by one-way analysis of variance (ANOVA), followed by the Tukey–Kramer test. Differences with an associated probability (p values) of less than 5% (p < 0.05) were considered significant. *p < 0.05; **p < 0.01; ***p < 0.001.
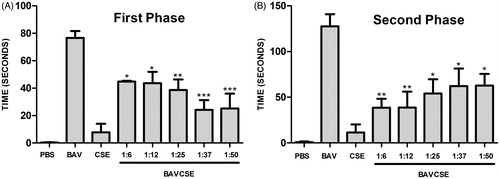
Table 1. Effect of CSE on the edema induced by B. atrox venom.
Figure 2. Peritonitis induced by B. atrox venom and treated with CSE. BAVCSE 1:6: BAV + 1.25 mg CSE/kg/50 μl PBS; BAVCSE 1:12: BAV + 2.5 mg CSE/kg/50 μl PBS; BAVCSE 1:25: BAV + 5.0 mg CSE/kg/50 μl PBS; BAVCSE 1:37: BAV + 7.5 mg CSE/kg/50 μl PBS; BAVCSE 1:50: BAV + 10 mg CSE/kg/50 μl PBS. The results are presented as the mean ± SEM for five animals. Differences between BAVCSE groups and BAV group were analyzed by one-way analysis of variance (ANOVA), followed by Tukey–Kramer test. Differences with an associated probability (p values) of less than 5% (p < 0.05) were considered significant. *p < 0.05; **p < 0.01.
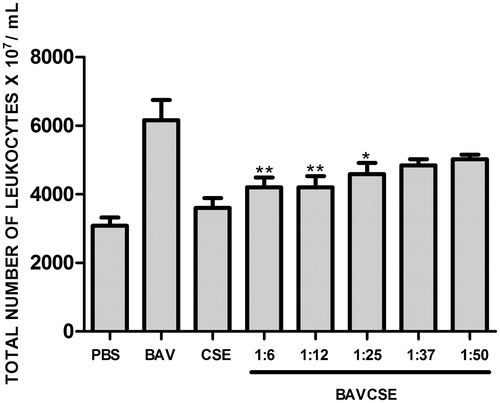
Figure 3. CSE effect on B. atrox venom coagulant activity. BAV: 20 μg/50 μl PBS. BAVCSE 1:1: BAV + 26 μg CSE/50 μl PBS; BAVCSE 1:2: BAV + 52 μg CSE/50 μl PBS; BAVCSE 1:5: BAV + 104 μg CSE/50 μl PBS; BAVCSE 1:10: BAV + 208 μg CSE/50 μl PBS; BAVCSE 1:20: BAV + 416 μg CSE/50 μl PBS. Each experiment was carried out in triplicate. Differences between BAVCSE groups and BAV group were analyzed by one-way analysis of variance (ANOVA), followed by Tukey–Kramer test. Results did not vary significantly as compared with BAV (p > 0.05).
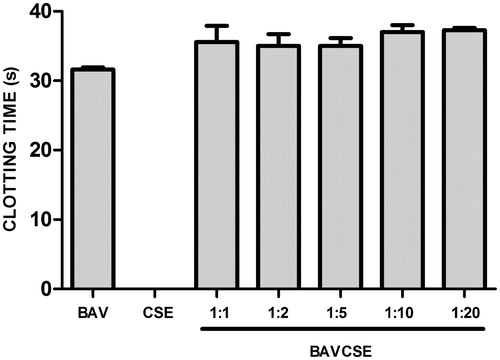
Figure 4. Effect of CSE on haemorrhage induced by B. atrox venom. BAV: 0.40 mg/50 μl PBS. BAVCSE 1:16: BAV + 3.2 mg CSE/kg/50 μl PBS; BAVCSE 1:32: BAV + 6.4 mg CSE/kg/50 μl PBS; BAVCSE 1:64: BAV + 12.8 mg CSE/kg/50 μl PBS; BAVCSE 1:96: BAV + 19.2 mg CSE/kg/50 μl PBS; BAVCSE 1:128: BAV + 25.6 mg CSE/kg/50 μl PBS. The results are presented as the mean ± SEM of five animals. Differences between BAVCSE groups and BAV group were analyzed by one-way analysis of variance (ANOVA), followed by Tukey–Kramer test. Results in BAVCSE experiments did not vary significantly as compared with BAV (p > 0.05).
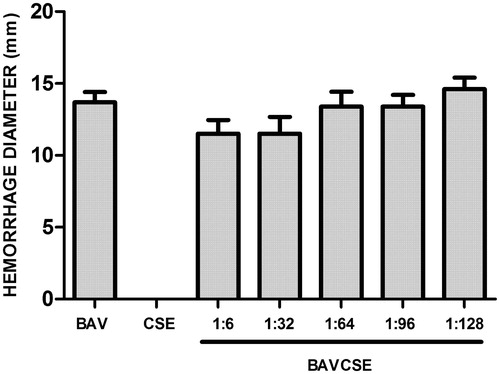
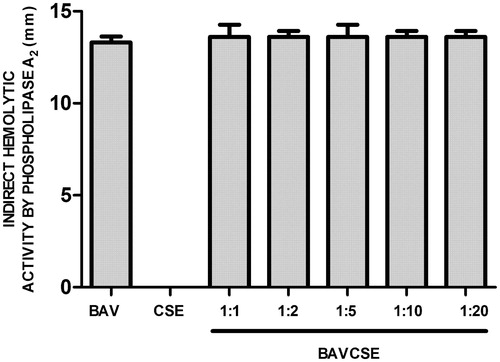
Figure 5. Effects of CSE on phospholipase A2 activity of B. atrox venom. BAV: 20 μg/50 μl PBS. BAVCSE 1:1: BAV + 26 μg CSE/50 μl PBS; BAVCSE 1:2: BAV + 52 μg CSE/50 μl PBS; BAVCSE 1:5: BAV + 104 μg CSE/50 μl PBS; BAVCSE 1:10: BAV + 208 μg BGE/50 μl PBS; BAVCSE 1:20: BAV + 416 μg CSE/50 μl PBS. The results are presented as the mean ± SEM of five animals. Differences between BAVCSE groups and BAV group were analyzed by one-way analysis of variance (ANOVA), followed by Tukey–Kramer test. Results in BAVCSE experiments did not vary significantly as compared with BAV (p > 0.05).