Figures & data
Figure 1. Gel electrophoresis pattern of the DNA plasmid incubated with Fenton’s reagent both in the presence and in the absence of flowers extracts from D. Simplex. Lane 1: untreated control: native DNA plasmid (0.5 μg); lanes 2 and 3: DNA with ethyl acetate extract at 500 and 250 μg/mL, respectively; lanes 4 and 5: DNA with ethanol extract at 500 and 250 μg/mL, respectively; lane 6: DNA sample incubated with Fenton’s reagent.
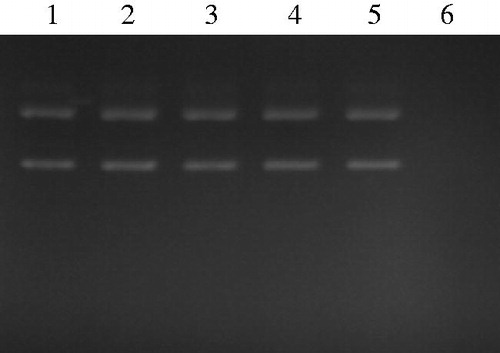
Table 1. Polyphenolic and flavonoid contents, and antioxidant activities of extracts from D. simplex flowers.
Figure 2. Effect of ethyl acetate and ethanol extracts from D. simplex flowers on phospholipase activity. Data are presented as mean ± SD of triplicate determinations. Different letters above the bars indicate significant differences when compared with the control: b (p < 0.01) and c (p < 0.001).
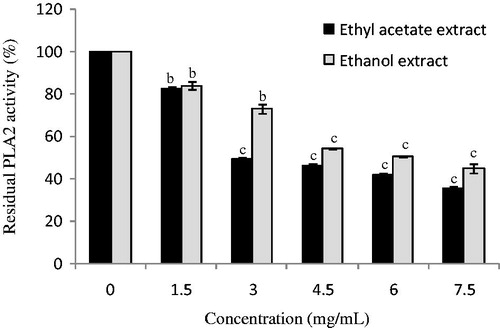
Figure 3. (A) Effect of ethyl acetate and ethanol extracts from D. simplex flowers, and indomethacin as positive control administered intraperitoneally on carrageenan-induced paw oedema in mice. Each point represents the mean of five animals and different letters above the bars indicate significant differences when compared with the negative control group: c (p < 0.001). (B) Photographs of paw oedema in mice at 4 h after injection of different treatments.
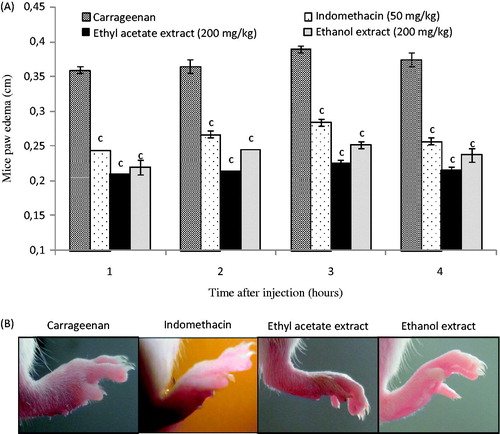
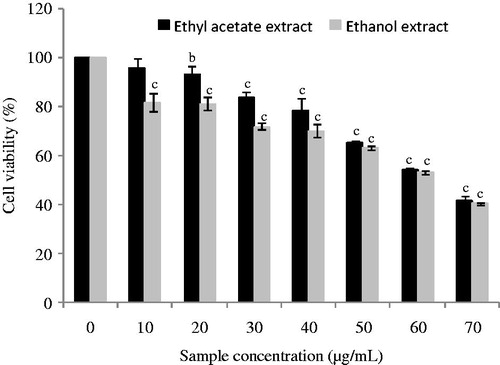
Figure 4. Antiproliferative activity of ethyl acetate and ethanol extracts from D. simplex flowers on Caco-2 cancer cells. Data are presented as mean ± SD of triplicate determinations. Different letters above the bars indicate significant differences when compared with the control: b (p < 0.01) and c (p < 0.001).