Figures & data
Table 1. The 1H- and 13C NMR data for compound 1 in CD3OD.
Figure 1. Chemical structures of flavonoids isolated from the hydroalcoholic extract of Calligonum polygonoides.
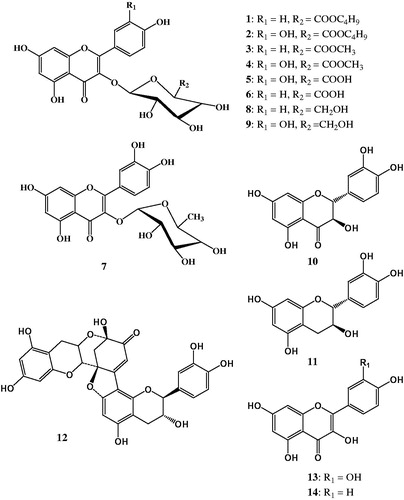
Figure 2. Dose–response curves for cytotoxic effects of the flavonoids isolated from the hydroalcoholic extract of Calligonum polygonoides. Numbers written above each graph correspond to chemical structures in . Cytotoxicity was assessed on HepG2 (solid line) and MCF-7 (dotted line).
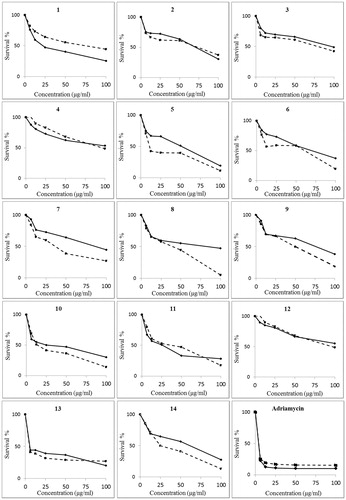
Table 2. Cytotoxic activity (IC50, μg/mL) of flavonoids isolated from Calligoum polygonoides.
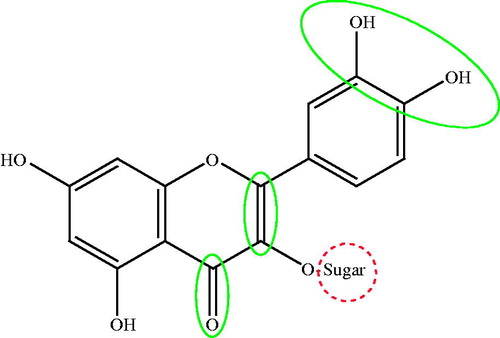
Figure 3. Structure elements in flavonoids that increase (solid circle) or decrease (dotted circle) cytotoxic activity against breast cancer cells.