
Figures & data
Table 1. 1H NMR (pyridine-d5, 400 MHz) and 13C NMR (pyridine-d5, 100 MHz) data for Compound 1 (δ values in ppm, J values in Hz are in parentheses).
Figure 1. Chemical structure of compound 1 isolated from I. asprella.
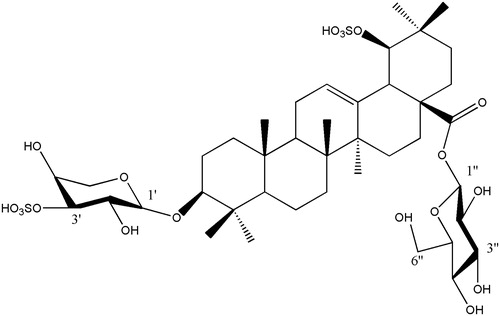
Figure 2. Chemical structure of compound 2 isolated from I. asprella.
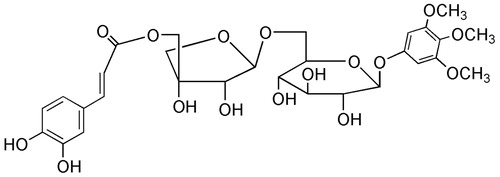
Figure 3. The key HMBC correlation (H–C) of compound 1.
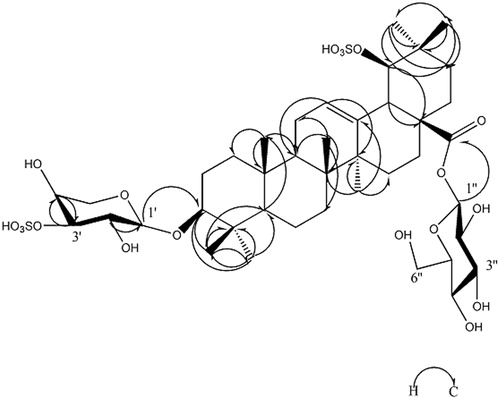
Figure 4. Inhibitory effects of Oseltamivir on the neuraminidase and IP-10 activity. The bar indicates the standard deviation of three different experiments.
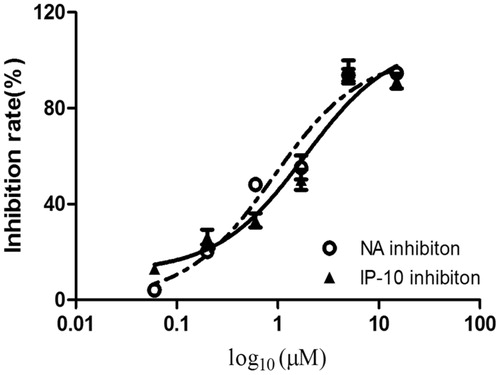
Figure 5. Inhibitory effects of compound 1 on the neuraminidase and IP-10 activity. The bar indicates the standard deviation of three different experiments.
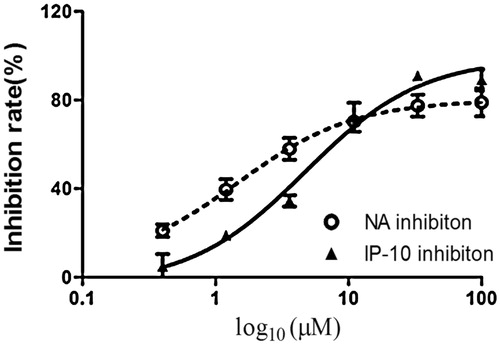
Table 2. Cytotoxicity and inhibitory effects of compounds 1 and 2 on neuraminidase activity.
Table 3. Cytotoxicity and inhibitory effects of compounds 1 and 2 on IP-10 activity.
Figure 6. Inhibitory effects of compound 2 on the neuraminidase and IP-10 activity. The bar indicates the standard deviation of three different experiments.
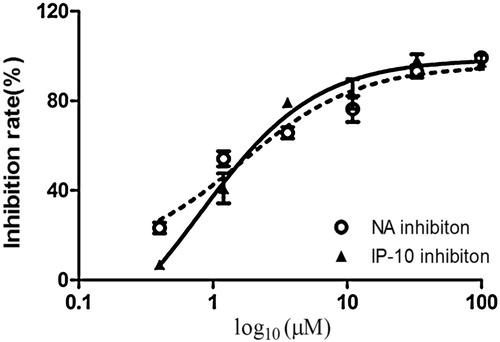
Table 4. Inhibitory effects of compounds 1 and 2 on platelet aggregation.