
Figures & data
Table 1. Serum concentrations of lipids parameters in rabbits measured on the 20th day and 30th day (n = 8).
Figure 1. Macroscopic and histological photographs of rabbit hearts. Compared to a normal diet rabbit (A and D), high-fat diet animal (B and E) exhibited excessive fat deposition in epicardium; ATP supplementation rabbit (C and F) reduced the fat deposition. The measurement for the thickness of fat layer in epicardium displayed a significant decrease in ATP supplementation rabbit compared to high-fat diet animals (G). #p < 0.05 versus normal diet; *p < 0.05 versus high-fat diet. N = 8.
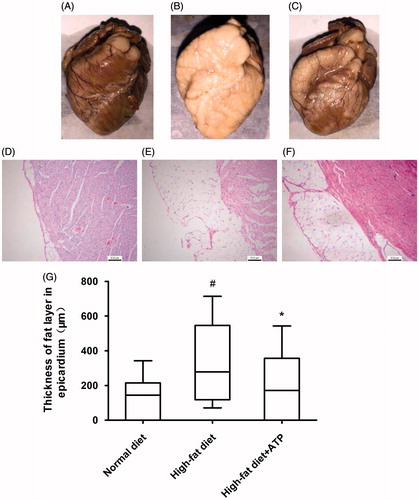
Figure 2. Histological findings in rabbit liver. (A) Representative histological photograph from a normal diet-fed rabbit. (B) Severe ballooning degeneration in hepatocyte in high-fat diet fed rabbit. (C) Mild ballooning degeneration in hepatocyte in a ATP supplementation rabbit. (D) ATP supplementation resulted in a significant reduction in grading of ballooning degeneration in hepatocytes. #p < 0.05 versus normal diet; *p < 0.05 versus high-fat diet. N = 8.
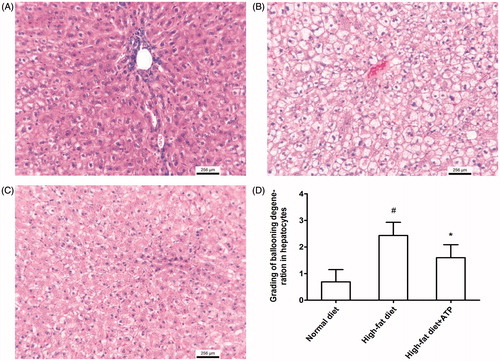
Figure 3. Histological photograph of rabbit aorta. (A) Photograph of thoracic aorta from a normal diet-fed rabbit. (B) Many foam cells observed from a high-fat diet rabbits. (C) Fewer foam cells observed from a ATP supplementation rabbit.
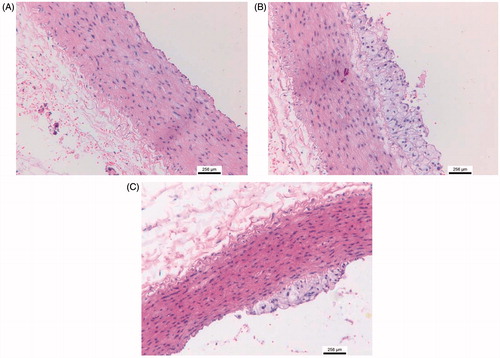
Table 2. Effect of ATP supplementation on serum concentrations of lipids and lipoproteins in patients with hypertriglyceridemia.