Figures & data
Figure 1. Effect of AMF on total WBC count (A) and haemoglobin level (B) in cisplatin treated mice. The data obtained were represented as mean ± SEM (n = 6) and analysed using one-way ANOVA and group means were compared using the Tukey–Kramer multiple comparison test. The values are statistically different from vehicle control at p < 0.05a, 0.01b and 0.001c and the values > 0.05 are considered to be non-significant.
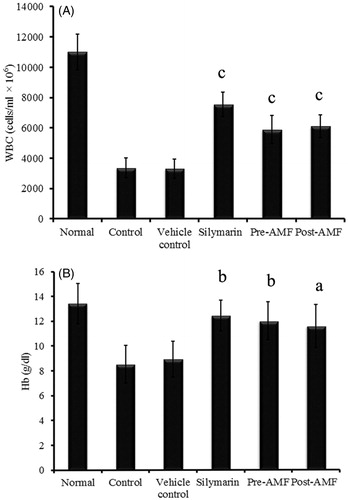
Figure 2. Effect of AMF on serum creatinine (A) and urea (B) levels in cisplatin treated mice. The data were represented as mean ± SEM (n = 6) and analysed using one-way ANOVA and group means were compared using the Tukey–Kramer multiple comparison test. The values are statistically different from the control at p < 0.05a, 0.01b and 0.001c and the values > 0.05 are considered to be non-significant.
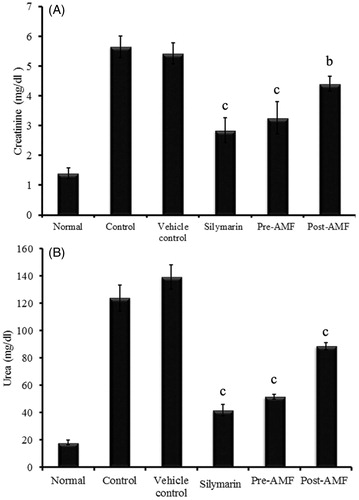
Figure 3. Effect of AMF on SOD (A), GPx (B), CAT (C) activities and GSH (D) level in kidney tissue of cisplatin treated mice. The data obtained were represented as mean ± SEM (n = 6) and analysed using one-way ANOVA and group means were compared using the Tukey–Kramer multiple comparison test. The values are statistically different from the control at p < 0.05a, 0.01b and 0.001c and the values >0.05 are considered to be non-significant.
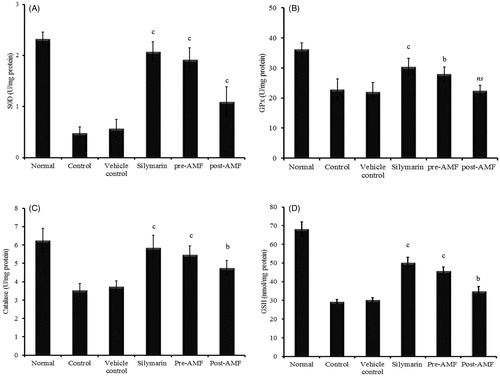
Figure 4. Effect of AMF on lipid peroxidation in the kidney tissue of cisplatin treated mice. The data obtained were represented as mean ± SEM (n = 6) and analysed using one-way ANOVA and group means were compared using the Tukey–Kramer multiple comparison test. The values are statistically different from the control at p < 0.05a, 0.01b and 0.001c and the values >0.05 are considered to be non-significant.
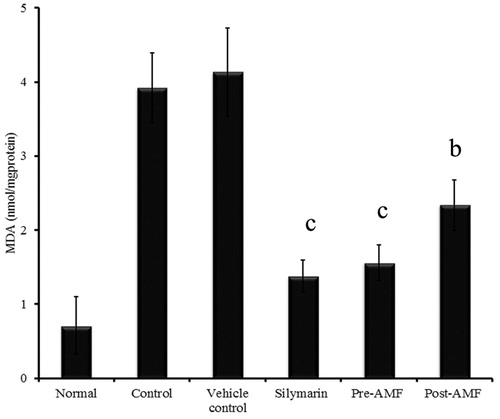
Figure 5. Histopathology of mouse kidney. (A) normal (B) cisplatin alone (16 mg/kg); (C) cisplatin and silymarin (100 mg/kg); (D) cisplatin and AMF (250 mg/kg) treated mice. The slides were observed under light microscope at 400× magnification.
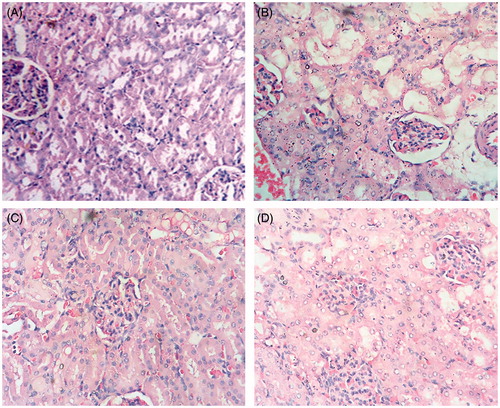
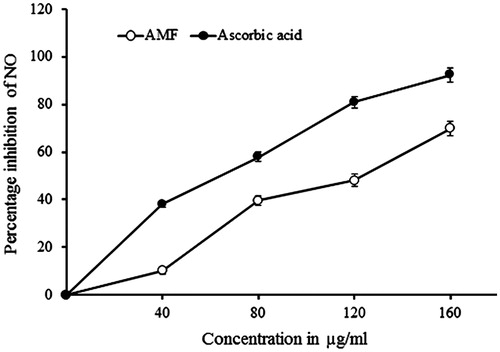
Figure 6. Nitric oxide (NO) radical scavenging effect of AMF. Ascorbic acid was used as a standard drug. Values are calculated as mean ± standard deviation of three independent replicates.