Figures & data
Table 1. Stability of OMT (1 μg/mL) in different pH Hanks (mean ± SD, n = 5).
Figure 1. Time effects on the transport of OMT (10−4 M) across MDCK cell monolayers on AP side at 37 °C. Each point represents the mean ± SD of three different cell monolayers.
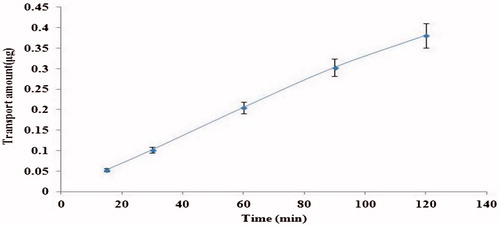
Figure 2. Concentration effects on the transport of OMT across MDCK cell monolayers. OMT transport amount was measured at 37 °C after 120 min incubation. Data are presented as mean ± SD of three different cell monolayers.
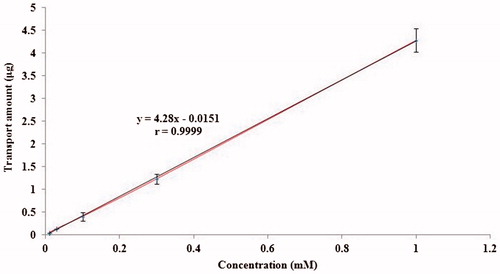
Figure 3. Concentration effects on the transport of OMT across MDCK cell monolayers. Cells were incubated with OMT 10−4 M from AP to BL compartment for 2 h at 37 °C. Each point represents the mean ± SD of three different cell monolayers.
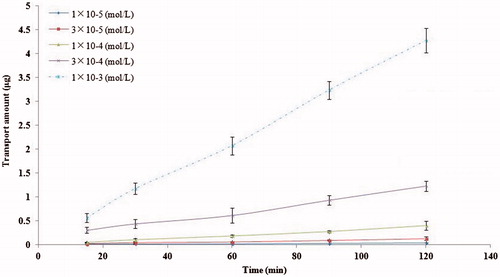
Table 2. Papp of OMT at different concentration across MDCK monolayers (Mean ± SD, n = 3).
Figure 4. Effects of temperature on OMT (10−4 M) transport across MDCK cell monolayers. Data are represented as mean ± SD of three different cell monolayers.
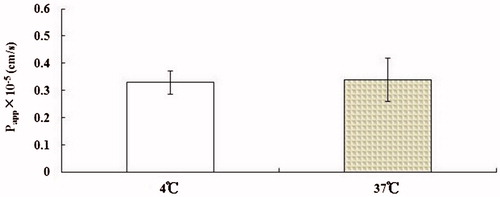
Figure 5. Effect of pH on OMT (10−4 M) transport across MDCK cell monolayers. Transport of OMT was measured at 37 °C for 30 min. Asterisks signs denote significant differences; **p < 0.01 versus control (pH 5).
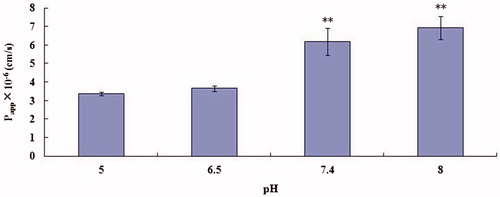
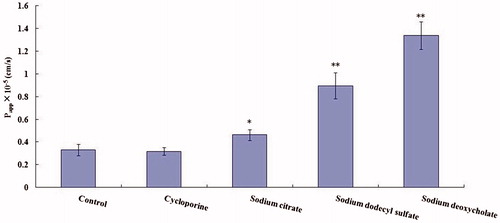
Figure 6. Effect of transport enhancers on Papp of OMT (10−4 M) across MDCK cells. Transport of OMT was measured at 37 °C for 15 min. Results are expressed as mean ± SD of three different cell monolayers. Asterisks signs denote significant differences; *p < 0.05 versus control; **p<0.01 versus control.