Figures & data
Table 1. Independent variables and their coded and actual values used in the central composite rotatable design.
Table 2. Response values (mean ± SD, n = 3) of total phenolics content, total flavonoids content and antioxidant activity for given levels of variables (ethanol concentration, extraction time and liquid-to-solid ratio) in RSM.
Table 3. Regression coefficients and analysis of variance (ANOVA) of the predicted quadratic model to the responses total phenolics content, total flavonoids content and antioxidant activity.
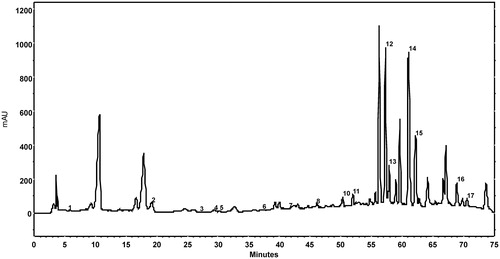
Figure 1. Response surface plots of total phenolics content (mg GAE/L) at optimum ethanol concentration (% v/v) (a), extraction time (min) (b) and liquid-to-solid ratio (v/w) (c).
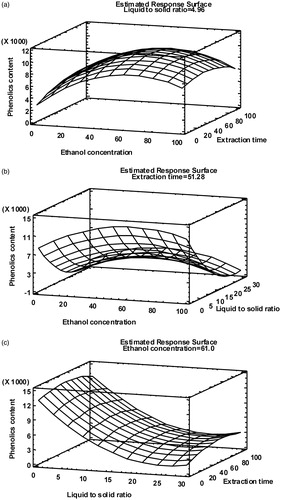
Figure 2. Response surface plots of total flavonoids content (mg QE/L) at optimum ethanol concentration (% v/v) (a), extraction time (min) (b) and liquid-to-solid ratio (v/w) (c).
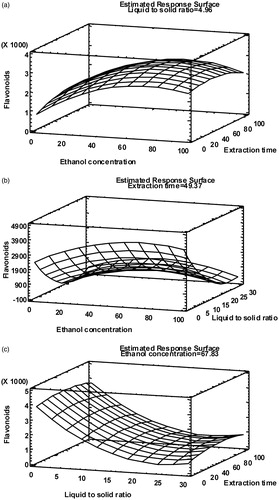
Table 4. Parameters of calibration curves, LODs and LOQs for HPLC method validation and content of phenolic compounds in walnut leaves extracts (79% ethanol concentration, 9.0 v/w liquid to solid ratio, 25 min extraction time).
Figure 3. Chromatogram at λ = 278 nm of an walnut leaves extract (79% ethanol concentration, 9.0 v/w liquid to solid ratio, 25 min extraction time) using 1% aqueous acetic acid solution in mobile phase A, methanol in mobile phase B, and the following gradient: 0–27 min 90% A, 27–55 min 90–60% A, 55–60 min 60% A, 60–62 min 60–56% A, 62–70 min 56% A, 70–71 min 56–90% A and 71–75 min 90% A. Peaks: 1, gallic acid; 2, catechin hydrate; 3, vanillic acid; 4, chlorogenic acid; 5, caffeic acid; 6, syringic acid; 7, epicatechin; 8, p-coumaric acid; 9, ferulic acid; 10, sinapic acid; 11, salicylic acid; 12, rutin; 13, ellagic acid; 14, myricetin; 15, juglone; 16, trans-cinnamic acid; 17, quercetin.