Figures & data
Figure 1. Extraction yield (%) of selected seaweed species assessed with three different organic solvents. The data are expressed as the mean ± standard error and were analyzed by unifactorial ANOVA followed by a Tukey test to assess significant differences. Means not sharing the same superscripts are significantly different (p < 0.05). n = 3 samples for treatment. Hexane, acetone and methanolic extractions are represented by black, grey and white bars, respectively.
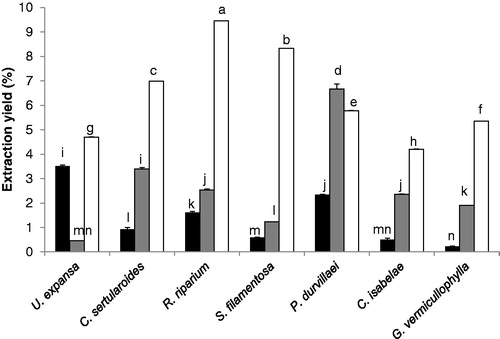
Figure 2. (a) PC1 and (b) PC2 obtained from total antioxidant compounds (flavonoids, total phenolic compounds, total chlorophylls content, chlorophyll a and b, and total carotenoids content) and antioxidant activity assessed with (b) DPPH and (c) ABTS in selected seaweeds extracted in hexane, acetone and methanol. The data are expressed as the mean ± standard error. See for statistical analysis. DPPH are expressed in vitamin C equivalents of antioxidant capacity (VCEAC) and ABTS in mg of VCE per 100 mg of dry extract (n = 3).
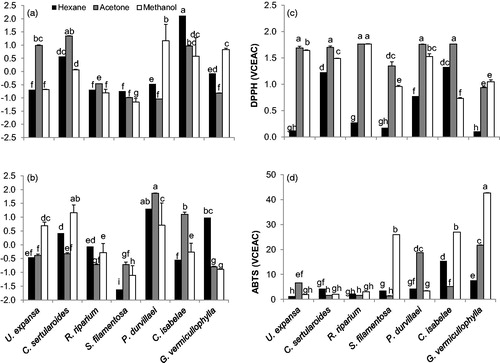
Table 1. Factor loadings (Varimax normalized) using principal components extraction and correlation of PC with antioxidant capacity of seaweed extracted in hexane, acetone and methanol.
Table 2. Total phenolic content (TPC), flavonoid content (FC), total chlorophylls and carotenoid content (TCC: Ct, total chlorophyll; Ca, chlorophyll a; Cb, chlorophyll b; and Cx + C, total carotenoids) in hexane (H), acetone (A) and methanol (M) extracts of selected seaweeds.
Figure 3. Antioxidant activity of selected seaweed extracts and controls (vitamin C and Trolox) expressed as the effective concentration (EC50 mg/mL) to assess 50% of the radical scavenging activity of (a) DPPH and (b) ABTS. The data are expressed as the mean ± standard error. See for statistical analysis. A = acetone, M = methanol.
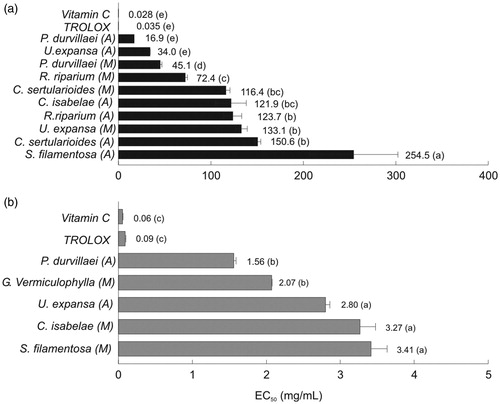
Figure 4. Antimutagenic activity (% inhibition) of acetone extracts of C. sertularioides, R. riparium and S. filamentosa assessed at different concentrations (0.003–3.0 mg/plate) on (a) S. typhimurium TA98 and (b) TA100. Mutagen aflatoxin B1 (500 ng/plate) was used as a positive control and spontaneous revertants in S. typhimurium culture were metabolically activated in all the treatments. The data are expressed as the means ± standard error (n = 3). Activity reference values (% of reversion inhibition > 40 = strong-, 25–40 = moderate- and <25 = weak antimutagenic activity) were used according to Ikken et al. (Citation1999).
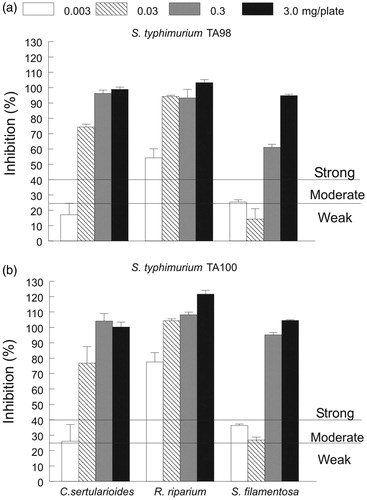
Table 3. Antimutagenic activity of seaweed extracts against aflatoxin B1mutagen on S. typhimurium TA98 and S. typhimurium TA100.
Figure 5. Representative images (20×) for changes observed in cell morphology of M12.C3.F6 (murine B-cell lymphoma) after treatment with seaweed extracts (100 μg/mL) and concentration effect of acetone extract of C. sertularioides (CsA). Code images: XxY, where Xx = seaweeds species (Ue, U. expansa; Cs, C. sertularioides; Rr, R. riparium; Sf, S. filamentosa; Pd, P. durvillaei; Ci, C. isabelae; and Gv, G. vermiculophylla) and Y = type of extract (H, hexane; A, acetone; M, methanol) CU1 and CU2: Are untreated controls, with DMSO used in the screening and CsA treatment, respectively.
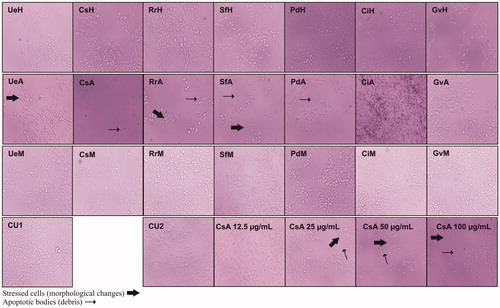
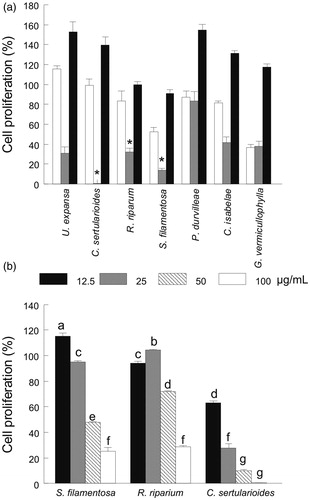
Figure 6. (a) Effect of the extraction solvent (i.e., hexane, white bars; acetone, grey bars or methanol, black bars) on the cell proliferation (%) of selected seaweeds and (b) concentration effect (12.5–100 μg/mL) of the acetone extract of S. filamentosa, R. riparium and C. sertularioides on cell proliferation (%). Control cell cultures were incubated with DMSO (0.5%), which represented 100% proliferation. The data are expressed as the means ± standard error. See for statistical analysis.