Figures & data
Table 1. Sequences of the primers.
Table 2. Total phenolic content (TPC), total flavonoid content (TFC) and flavonone, and dihydroflavonol content (FDC) of EECP, EEEP and EEBGP.Table Footnotea
Figure 1. HPLC chromatograms of the 22 monomers in EEBGP, EEEP and EECP. (A) 1, Vanillic acid; 2, caffeic acid; 3, p-coumaric acid; 4, ferulic acid; 5, isoferulic acid; 6, 3,4-dimethoxycinnamic acid; 7, rutin; 8, cinnamic acid; 9, pinobanksin; 10, naringenin; 11, quercetin; 12, luteolin; 13, kaempferol; 14, apigenin; 15, pinocembrin; 16, 3-O-acetylpinobanksin; 17, chrysin; 18, CAPE; 19, galangin. (B) 20, Chlorogenic acid; 21, kaempferide; 22, artepillin. (C) a, Standards; b, EEBGP; c, EEEP; d, EECP.
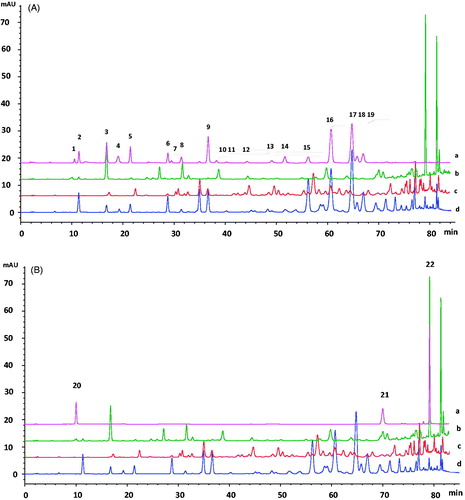
Table 3. Contents of the monomers in EEBGP, EEEP and EECP determined by HPLC analysis.Table Footnotea
Table 4. Free radical scavenging activities and reducing power of EECP, EEEP and EEBGP.Table Footnotea
Figure 2. The effects of EEEP, EEBGP and EECP on viability of RAW264.7 cells.
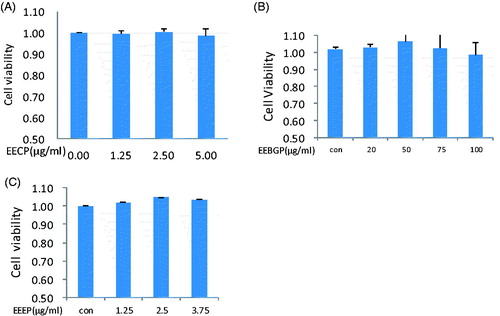
Figure 3. ROS elimination effects of EECP, EEEP and EEBGP in RAW264.7 cells. (A) A representative result of the flow cytometry analysis. (B) Each bar represents the inhibition percentage of ROS regulated by EECP, EEEP and EEBGP with the indicated concentrations (μg/mL).
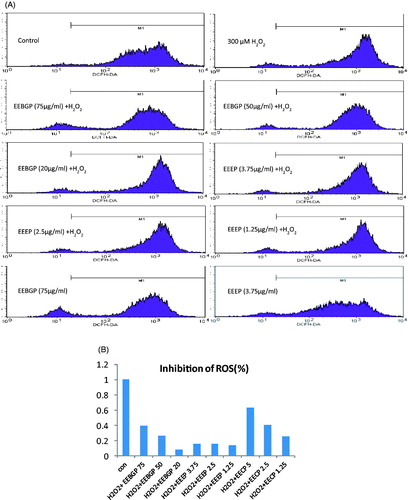
Figure 4. Antioxidant gene expression (HO-1, GCLM, TrxR1 and GCLC) at the mRNA level regulated by EECP, EEEP and EEBGP. (A–D) RAW264.7 cells incubated with EECP (5 μg/mL), EEEP (3.75 μg/mL) and EEBGP (75 μg/mL) for the indicated hours. (E–H) RAW264.7 cells treated with the indicated concentrations of EECP, EEEP and EEBGP for 6 h. All the genes expressed at mRNA level were determined by qRT-PCR and GAPDH was used as an internal reference gene. *Represents sample group versus control group; #represents sample group versus sample group. All are mean p < 0.05.
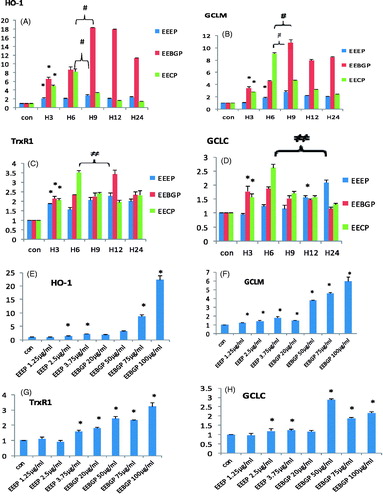
Figure 5. Antioxidant gene expression (HO-1, GCLM, TrxR1 and GCLC) at the protein level regulated by EECP, EEEP and EEBGP. RAW264.7 cells treated with EECP, EEEP and EEBGP at the indicated concentrations (A, C) and lengths of time (B, D). The data of antioxidant genes expression effects of EECP were not shown. All the genes expressed at protein level were detected by western blot and β-tubulin was used as an internal reference.
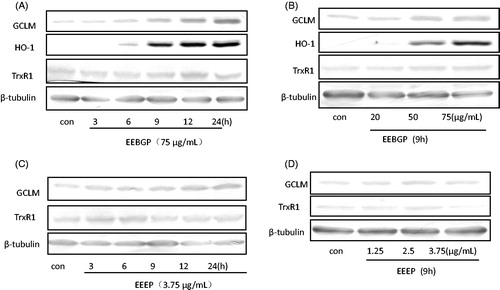
Figure 6. The regulation roles of MAPKs. (A–C) The stimulation effects of EEEP, EEBGP and EECP on the expression of MAPKs. (D–E) To determine the inhibition effects of the inhibitors on p38 and Erk, RAW264.7 cells were pre-treated with SB203580 or PD98059 for 0.5 h and then cultured in the presence or absence of EEEP, EEBGP and EECP for 1 h. (F–I) To confirm that the expression of HO-1, GCLM and TrxR1 was regulated by p38/p-p38 kinase or Erk/p-Erk kinase, RAW264.7 cells were pre-treated with SB203580 or PD98059 for 0.5 h and cultured in the presence or absence of EEEP, EEBGP and EECP for 5 h, then the medium was removed, and the cells were cultured with new medium for an additional 4 h. All the genes expressed at protein level were detected by western blot and β-tubulin was used as an internal reference.
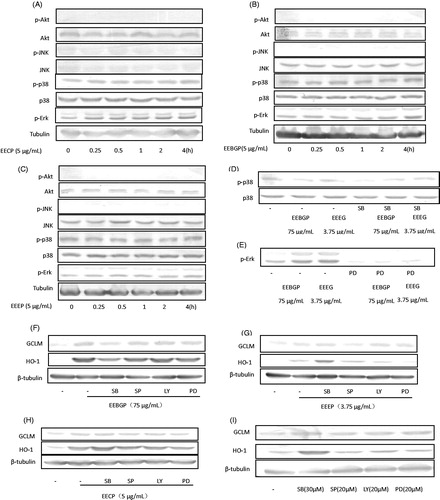
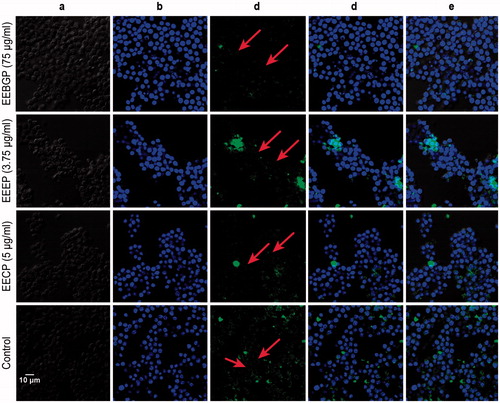
Figure 7. Nucleus translocation effects of Nrf2 stimulated by EECP, EEBGP and EEEP in RAW264.7 cells. Treatment of RAW264.7 cells were conducted with the indicated concentrations of EECP, EEBGP and EEEP for 4 h and Nrf2 nucleus translocations were assessed by laser scanning confocal microscopy. (A) Morphology of the RAW264.7 cells. (B) DAPI image of the nuclei. (C) Image of Nrf2 in RAW264.7 cells stained with Alexa Fluor 488-conjugated anti-rabbit IgG antibody. (D) Merged image of DAPI and Alexa Fluor 488-conjugated anti-rabbit IgG antibody. (E) Merged image of DAPI and Alexa Fluor 488-conjugated anti-rabbit IgG antibody and the morphology of RAW264.7 cells to clearly show the location of Nrf2.