Figures & data
Figure 1. Representative UPLC/DAD chromatograms. (A) Blank solvent, (B) 12 amino acid derivatives of standard solution, (C) amino acid derivatives in a representative plasma sample, (D) amino acid derivatives in a representative liver homogenate sample. (1) Glutamic acid; (2) serine; (3) glycine; (4) arginine; (5) is; (6) tyrosine; (7) valine; (8) methionine; (9) isoleucine; (10) leucine; (11) phenylalanine; (12) tryptophan; (13) lysine.
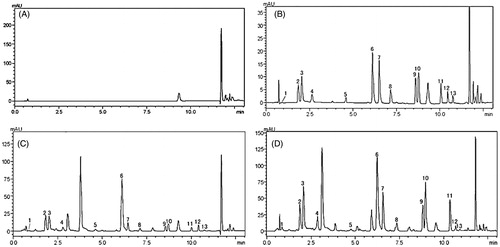
Table 1. Calibration curves of 12 amino acids derivatives for plasma.
Table 2. Calibration curves of 12 amino acids derivatives for liver.
Figure 2. PR analysis of the UPLC/DAD spectra of rat plasma. (A) PCA analysis of the spectra of plasma from normal and model rats (R2X = 0.752, Q2 = 0.574). (B) Scores plot of the PLS-DA analysis of the spectra from the plasma of normal and hyperlipidaemic rats (R2X = 0.749, R2Y = 0.939, Q2 = 0.92). (C) Scores plot of the PLS-DA analysis of the spectra from the plasma of normal, hyperlipidaemic and GP-treated rats (R2X = 0.776, R2Y = 0.822, Q2 = 0.738). (D) Scores plot of the PLS-DA analysis of the spectra from the plasma of normal, hyperlipidaemic and atorvastatin-treated rats (R2X = 0.777, R2Y = 0.758, Q2 = 0.668). (E) Loading plot of the PLS-DA analysis of the spectra from the plasma of normal and hyperlipidaemic rats (box: control group; dot: model group; diamond: GP-treated group; star: atorvastatin-treated group).
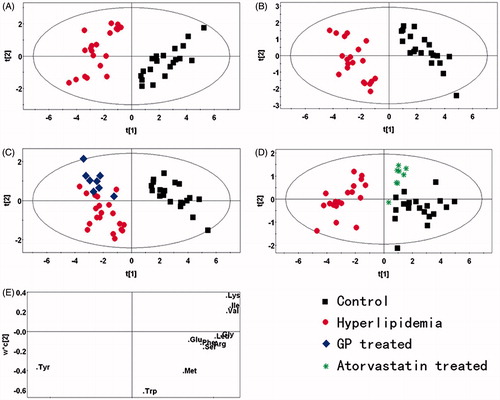
Figure 3. PR analysis of the UPLC/DAD spectra of rat liver. (A) PCA analysis of the spectra of liver from normal and model rats (R2X = 0.907, Q2 = 0.555). (B) Scores plot of the PLS-DA analysis of the spectra from the liver of normal and hyperlipidaemic rats (R2X = 0.777, R2Y = 0.934, Q2 = 0.902). (C) Scores plot of the PLS-DA analysis of the spectra from the liver of normal, hyperlipidaemic and GP-treated rats (R2X = 0.828, R2Y = 0.811, Q2 = 0.581). (D) Scores plot of the PLS-DA analysis of the spectra from the liver of normal, hyperlipidaemic and atorvastatin-treated rats (R2X = 0.755, R2Y = 0.773, Q2 = 0.569). (E) Loading plot of the PLS-DA analysis of the spectra from the liver of normal and hyperlipidaemic rats. (box: control group; dot: model group; diamond: GP-treated group; star: atorvastatin-treated group).
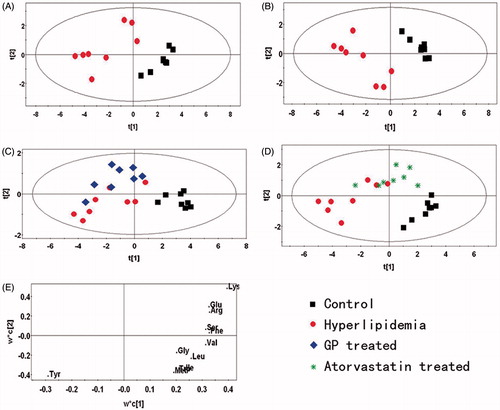
Table 3. Quantitative analysis of amino acids of plasma in four groups of rats (x ± s, μg/mL).
Table 4. Quantitative analysis of amino acids of liver in four groups of rats (x ± s, μg/mL).
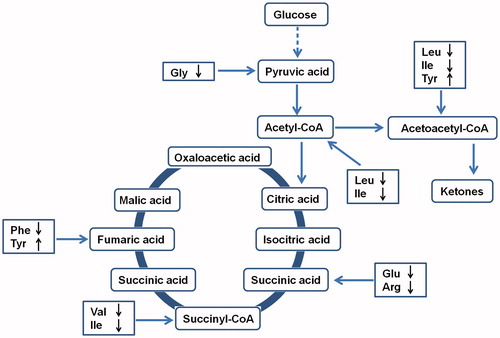
Figure 4. A summary of the related metabolic pathways for amino acids that changed significantly in hyperlipidaemic group. “↑” and “↓” represent the compound is up- and down-regulated compared with the control group.