
Figures & data
Table 1. Administration protocol.
Figure 1. Activity comparison of olive wine (A) and ascorbic acid (B) in scavenging DPPH free radicals.
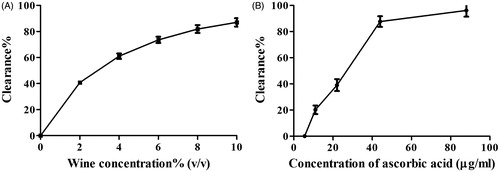
Figure 2. Activity comparison of olive wine (A) and ascorbic acid (B) in scavenging hydroxyl free radicals.
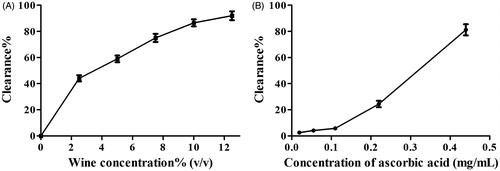
Figure 3. Activity comparison of olive wine (A) and ascorbic acid (B) in ferric reducing antioxidant power.
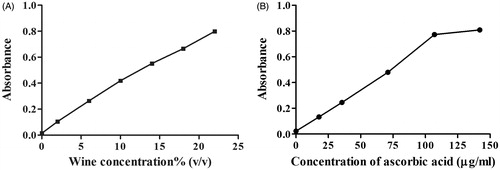
Table 2. MDA levels in plasma and liver of mice with different administration protocols.
Table 3. Protein carbonyl levels in plasma and liver of mice with different administration protocols.
Table 4. SOD activity in plasma and liver of mice administrated according to the proposed protocol.
Table 5. GSH levels in plasma and liver of mice administrated according to the proposed protocol.