Figures & data
Figure 1. The standard curve of compound A established with HPLC.
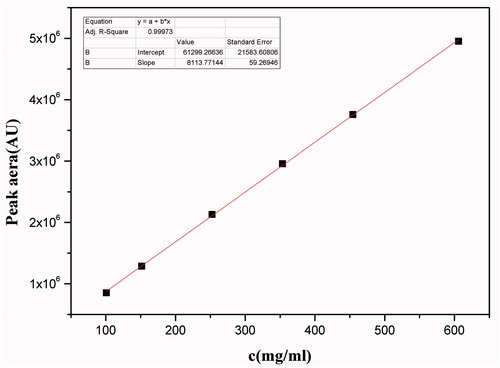
Figure 2. Representative chromatograms. (a) HPLC chromatogram of standard solution at the concentration of 252.5 μg/mL; (b) HPLC chromatogram of 20-times diluted QNM mixture.
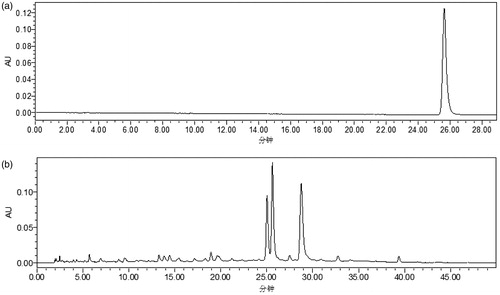
Table 1. The concentration of compound A in three tested QNM samples.
Figure 3. Comparison of the microscopic morphology of SH-SY5Y cells. (a) Normal cells; (b) OGD-treated cells.
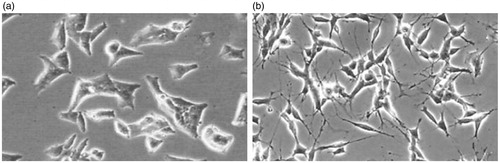
Figure 4. The effect of different concentrations of QNM on the viability of OGD-injured SH-SY5Y cells (*p< 0.05, **p< 0.01, compared with OGD group).
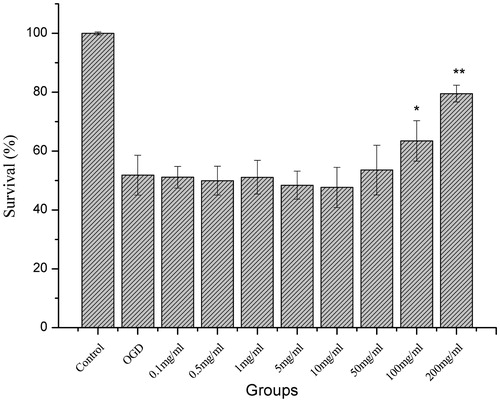
Table 2. The effect of QNM on the activities of C-3 and C-8 in OGD-injured SH-5Y5Y cells.
Figure 5. Flow cytometry analysis of SH-SY5Y cell apoptosis.
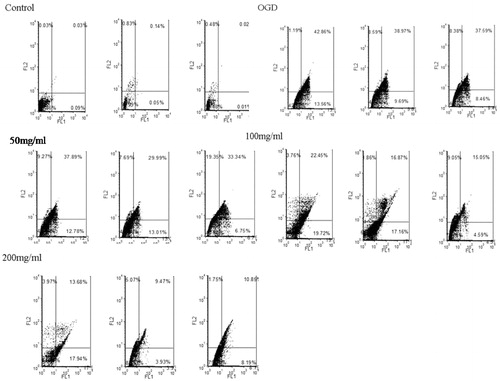
Figure 6. The effect of QNM on the apoptosis of OGD-injured SH-SY5Y cells (*p < 0.05, **p < 0.01, compared with OGD group).
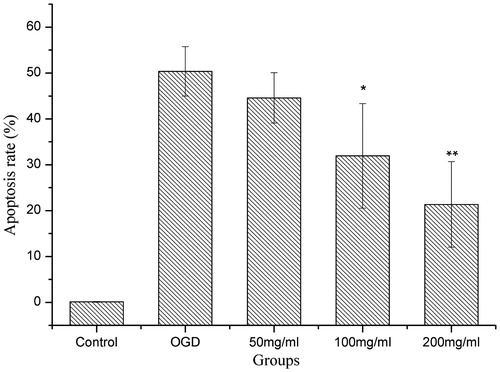
Figure 7. The effect of QNM on the weight ratio of cerebral infarction in rats. (*p < 0.05, **p < 0.01, compared with I/R injury group).
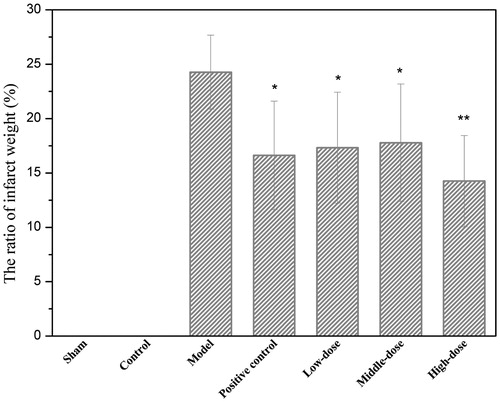
Figure 8. The effect of QNM on the histopathology of brain in rats after cerebral I/R injury shown by HE staining. (a) Sham group; (b) I/R injury group; (c) Positive group; (d) Low-dose group; (e) Medium-dose group; and (f) High-dose group. The original magnification was 400×.
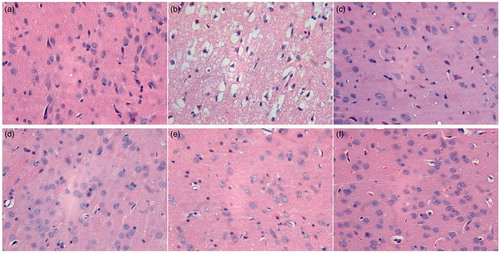
Figure 9. The effect of QNM on the number of Bcl-2/Bax-positive cells in rat brain tissue after I/R injury (*p < 0.05, compared with I/R injury group).
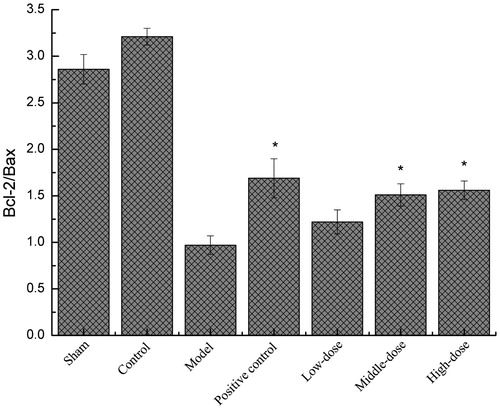
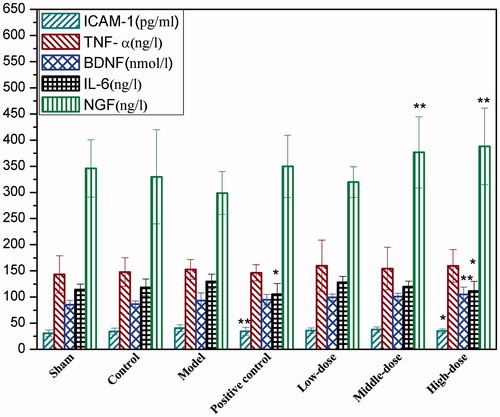
Figure 10. The detection results of serum markers in rat model of cerebral I/R injury (*p < 0.05, **p < 0.01, compared with I/R injury group).
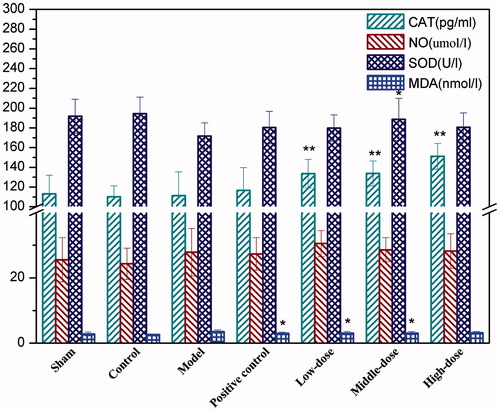
Figure 11. The detection results of cytokines in brain tissue homogenates in rat model of cerebral I/R injury (*p < 0.05, **p < 0.01, compared with I/R injury group).