
Figures & data
Figure 1. Chemical Structure of linalool.
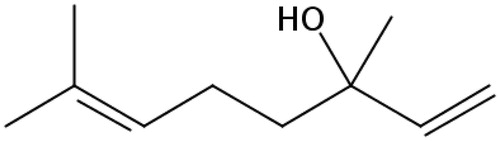
Table 1. Central composite design (CCD) matrix of four independent variables and the experimental results.
Table 2. ANOVA of the response surface model with 95% confidence level.
Figure 2. Three-dimensional (3D) response surfaces of two interaction effects on particle size (PS).
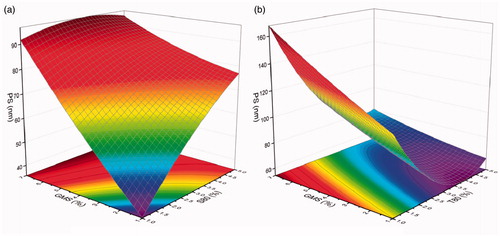
Figure 3. Particle size distribution of LL-NLCs.
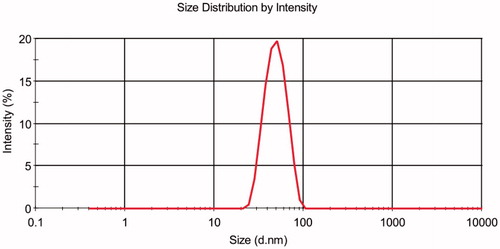
Figure 4. Zeta potential distribution of LL-NLCs.
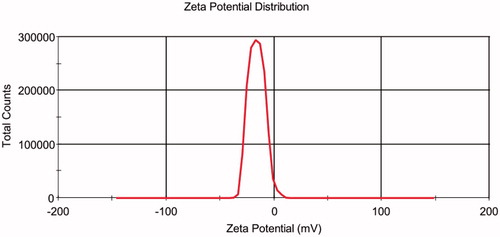
Figure 5. Transmission electron microscope (TEM) image of LL-NLCs.
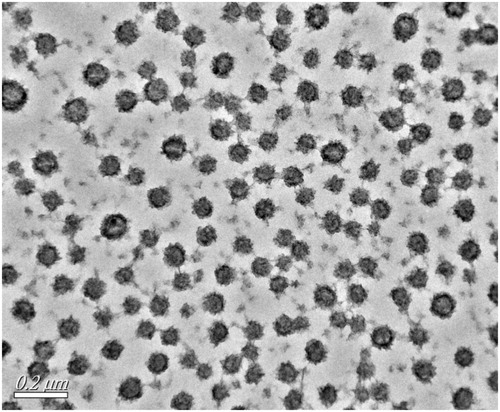
Figure 6. X-ray diffraction (XRD) images of mannitol, sucrose, glycerin monostearate (GMS), LL-NLCs and physical mixture of LL-NLCs/20% mannitol/20% sucrose.
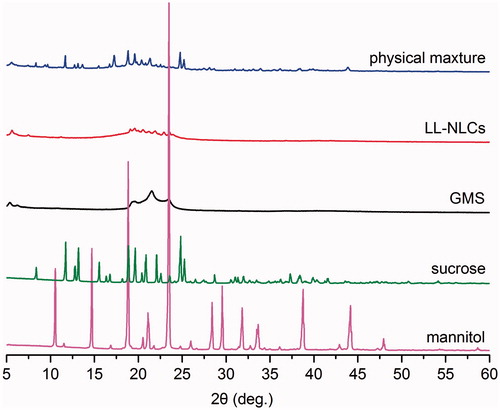
Figure 7. Differential scanning calorimetry (DSC) thermograms of mannitol, sucrose, GMS, LL-NLCs and physical mixture of LL-NLCs/20% mannitol/20% sucrose.
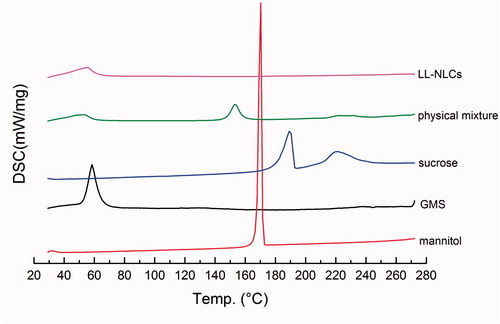
Figure 8. Dissolution curves of LL from free LL and LL-NLCs.
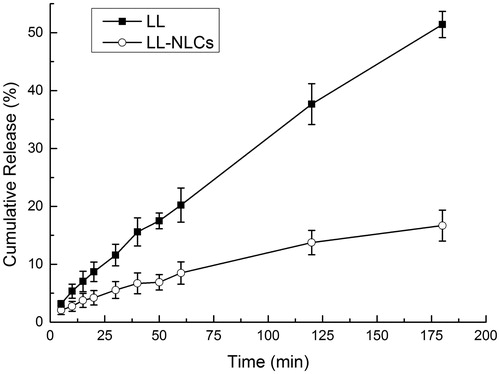
Figure 9. Time-dependent changes of LL-NLCs in the stability test (25 °C).
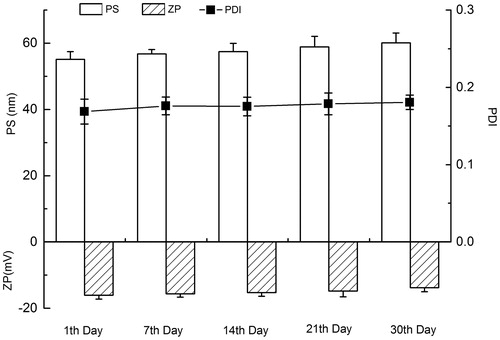
Figure 10. Drug concentration-time curve in plasma of LL after intragastric administration (n = 6).
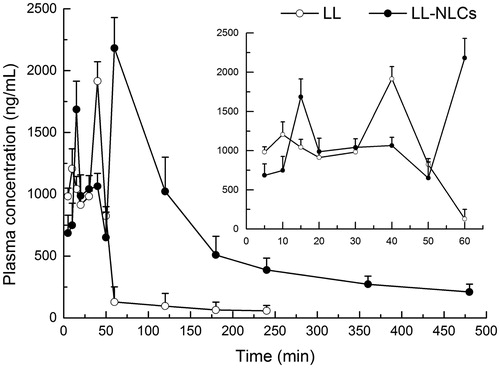
Table 3. Pharmacokinetic parameters of LL after intragastric administration in rats (mean, n = 6).