Figures & data
Figure 1. Chromatogram and absorption spectrum of RS catechin and F1, F2 and F3 active fractions in 1000 μg/mL. (a) RS catechin. Retention time: 19.744. (b) F1 active fraction (major peaks 1, 2 and 3) with retention time of peak catechin: 19.699. (c) F2 active fraction (major peaks 1 and 2) with retention time of peak catechin: 19.073. (d) F3 active fraction (major peaks 1 and 2) with retention time of peak catechin: 19.764. Analyzed by high performance liquid chromatography coupled to photodiode array detector (PDA). Wavelength: 280 nm. Ultra C18 pre-column 4.6 mm; 5 μ C18 100A column (250 × 4.6 mm). Mobile phase 0.05% phosphoric acid (solution A) and acetonitrile (solution B). Flow rate: 0.7 mL/min. Injection volume: 20 μL.
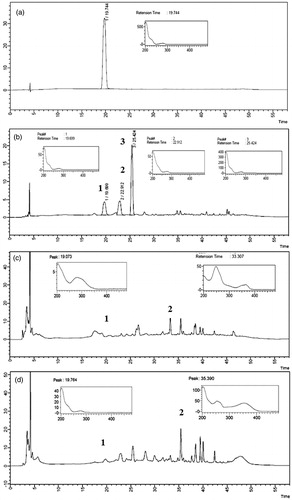
Figure 2. Standard calibration curve and regression equation for the catechin.
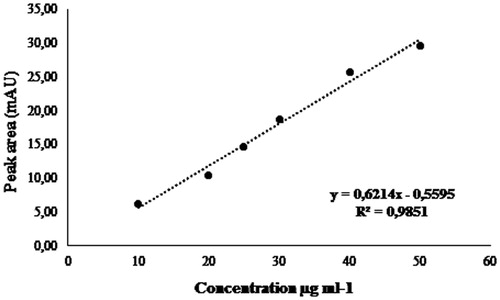
Table 1. Catechin concentrations present at the F1, F2 and F3 fractions.
Table 2. Minimum inhibitory concentration (MIC) values expressed in μg/mL of active fractions of A. sellowiana front the strains of non-albicans Candida.
Table 3. Minimum inhibitory concentration (MIC) values in 24 and 48 h to F1, F2 and F3 active fractions expressed in μg/mL front of Candida glabrata strains sensitive and resistant to FLZ.
Table 4. Evaluation of the interaction between the F2 active fraction and the FLZ against Candida glabrata strains.
Figure 3. (a) CG RL03. (b) CG RL22. (c) CG RL37m. Percentage of cellular damage found in the three most effective combinations resulting from the interaction between the F2 active fraction and fluconazole (F2 + FLZ). Horizontal axis: percentage of cellular damage obtained when the F2 active fraction was evaluated separately in two minimum inhibitory concentrations different. Depth axis: percentage of cellular damage obtained when the fluconazole (FLZ) was assessed separately in two minimum inhibitory concentrations different. Vertical axis: percentage of cellular damage resulting from the interaction between the F2 active fraction with fluconazole (F2 + FLZ) in different minimum inhibitory concentrations.
![]()
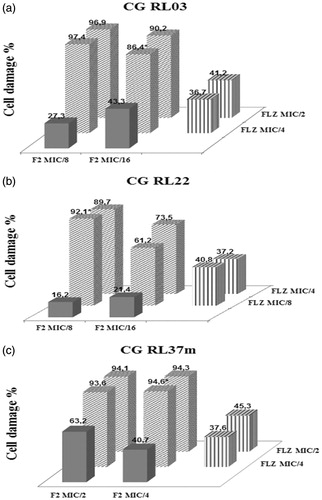
Figure 4. Morphological representation of C. glabrata strains susceptible to the effect of F2 active fraction through scanning electronic microscopy. (a) CG RL02S (5000 times magnification). (b) CG RL02S (10,000 times magnification). (c) CG RL34m (15,000 times magnification). (d) CG RL12S (10,000 times magnification). (e) CG RL37m (10,000 times magnification). (f) ATCC 40039 in RPMI 1640 (10,000 times magnification). Electric current: 5 kV.
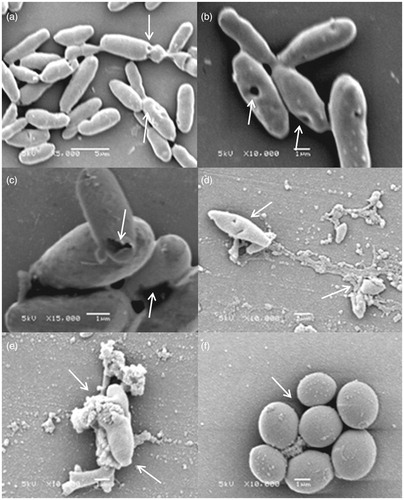
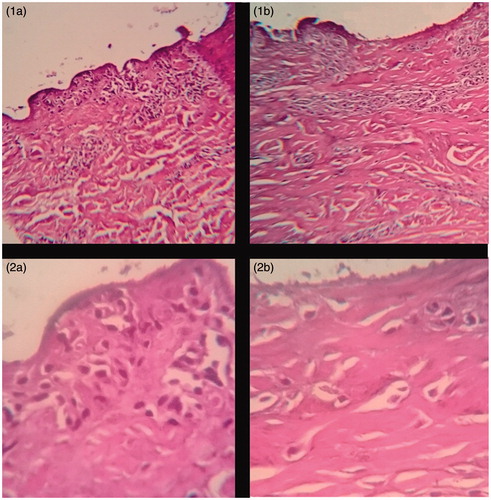
Figure 5. Histopathological evaluation of porcine cells treated with lyophilized aqueous extract of leaves of A. sellowiana and negative control at 100 and 400 times magnification. (1a) Swine epidermal cells treated with lyophilized aqueous extract of leaves of A. sellowiana at 1 mg/mL (100 times magnification). (1b) Swine epidermal cells treated with PBS buffer solution pH 7.0 (100 times magnification). (2a) Swine epidermal cells treated with lyophilized aqueous extract of leaves of A. sellowiana at 1 mg/mL (400 times magnification). (2b) Swine epidermal cells treated with lyophilized aqueous extract of leaves of A. sellowiana at 1 mg/mL (400 times magnification).