Figures & data
Figure 1. Chemical structures of some non-sterol triterpenes from the plant S. asper.
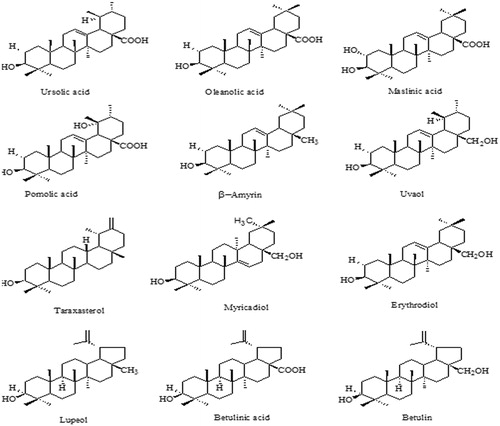
Table 1. Preliminary phytoprofile and percentage yield of crude extract and various fractions of the stem bark of S. asper Lour.
Table 2. Results of phytochemical tests of crude extract and various fractions of the stem bark of S. asper.
Figure 2. Spectral characterization of the isolated compound: (a) UV spectrum; (b) IR spectrum; (c) mass spectrum; (d) 1H NMR spectrum and (e) 13C NMR spectrum.
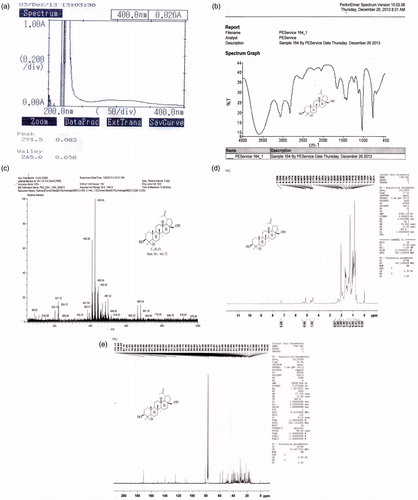
Table 3. Observed characterization details and predicted computational data of the isolated non-sterol triterpenoid, betulin.
Figure 3. (a) Calibration curve of standard betulin working standard solution; (b) 3D spectra of betulin working standard solutions (tracks 1–5), crude extract (track 6), n-hexane fraction (track 7) and isolated compound (track 8) scanned at 295 nm wavelength.
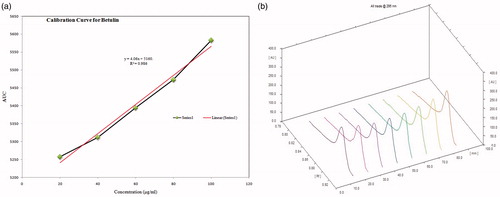
Figure 4. Fingerprints of (a) crude extract; (b) n-hexane fraction and (c) isolated compound.
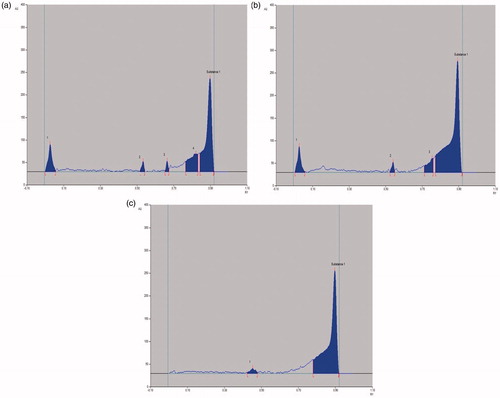
Figure 5. HPTLC chromatogram of (a) crude extract; (b) n-hexane fraction and (c) isolated compound, against standard biomarker, betulin.
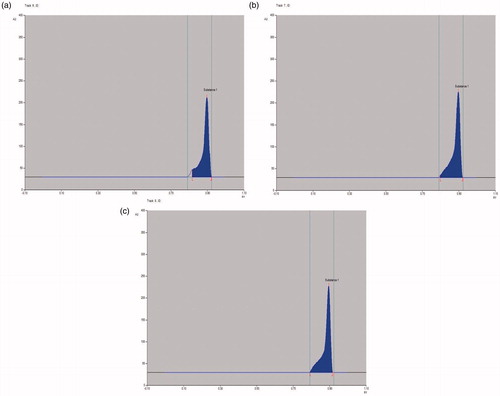
Table 4. Data showing quantity of betulin in crude extract, n-hexane fraction and isolated compound of S. asper.
Table 5. Data showing Rf range and area under the curve of standard betulin (Tracks 1–5), crude extract (Track 6), n-hexane fraction (Track 7) and isolated compound (Track 8).
Table 6. Data showing anticonvulsant, antidepressant and neurotoxicity studies of the crude extract, various fractions and isolated compound from S. asper Lour.
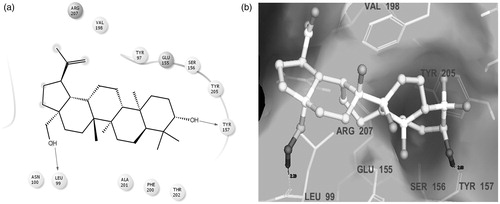
Figure 6. Binding modes of the isolated compound betulin at the GABAA receptor target protein: (a) 2D ligand interaction diagram; (b) 3D ligand interaction diagram, showing ligand–receptor H-bond interactions.