Figures & data
Table 1. Primer pairs used for PCR.
Table 2. Liver function markers in control and experimental mice.
Figure 1. Liver lipid peroxidation (A) and nitric oxide (B) in control, AOM and AOM mice treated with T. ornata and P. pavonia. Data are expressed as mean ± SEM. **p < 0.01 and ***p < 0.001 versus control and #p < 0.05, ##p < 0.01 and ###p < 0.001 versus AOM. MDA, malondialdehyde; NO, nitric oxide; AOM, azoxymethane; T. ornata, Turbinaria ornata; P. pavonia, Padina pavonia; SEM, standard error of the mean.
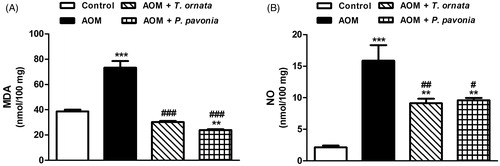
Figure 2. Liver glutathione content (A), and activity of SOD (B) and GPx (C) in control, AOM and AOM mice treated with T. ornata and P. pavonia. Data are expressed as mean ± SEM. *p < 0.05, **p < 0.01 and ***p < 0.001 versus control, ###p < 0.001 versus AOM and ††p < 0.01 versus AOM + T. ornata. GSH, glutathione; SOD, superoxide dismutase; GPx, glutathione peroxidase; AOM, azoxymethane; T. ornata, Turbinaria ornata; P. pavonia, Padina pavonia; SEM, standard error of the mean.
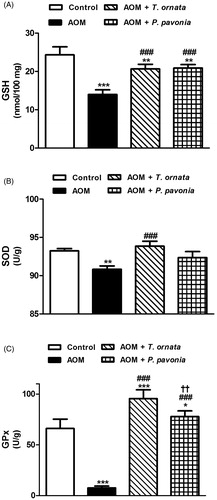
Figure 3. Photomicrographs of H&E stained liver sections of control, AOM and AOM mice treated with T. ornata and P. pavonia. (A and B) Liver sections of control mice showing normal histological structure of a hepatic lobule with central vein (cv) and blood sinusoid (s) (A ×400 and B ×1000), (C–F) liver sections of AOM group revealing fatty degeneration of hepatocytes (C), dilated sinusoids, congested blood vessels (D), inflammatory cell infiltration, necrosis (E), and oval cell proliferation (F) [×x400], (G and H) liver sections of AOM + T. ornata demonstrating marked improvement of liver architecture with mild fatty degeneration in some hepatocytes [×400], and (I and J) sections of AOM + P. pavonia showing more or less normal liver section, mild fatty changes and normal well differentiated nuclei [×400].
![Figure 3. Photomicrographs of H&E stained liver sections of control, AOM and AOM mice treated with T. ornata and P. pavonia. (A and B) Liver sections of control mice showing normal histological structure of a hepatic lobule with central vein (cv) and blood sinusoid (s) (A ×400 and B ×1000), (C–F) liver sections of AOM group revealing fatty degeneration of hepatocytes (C), dilated sinusoids, congested blood vessels (D), inflammatory cell infiltration, necrosis (E), and oval cell proliferation (F) [×x400], (G and H) liver sections of AOM + T. ornata demonstrating marked improvement of liver architecture with mild fatty degeneration in some hepatocytes [×400], and (I and J) sections of AOM + P. pavonia showing more or less normal liver section, mild fatty changes and normal well differentiated nuclei [×400].](/cms/asset/f52df764-ae96-4904-927c-720b3b2b6ff9/iphb_a_1160938_f0003_c.jpg)
Figure 4. PCR analysis of liver NF-κB in control, AOM and AOM mice treated with T. ornata and P. pavonia. (A) Gel photograph depicting representative NF-κB and β-actin PCR products. (B) Corresponding densitometric analysis of the PCR products. Data are expressed as mean ± SEM. *p < 0.05, **p < 0.01 and ***p < 0.001 versus control and ###p < 0.001 versus AOM. NF-κB, nuclear factor-kappa B; AOM, azoxymethane; T. ornata, Turbinaria ornata; P. pavonia, Padina pavonia; SEM, standard error of the mean.
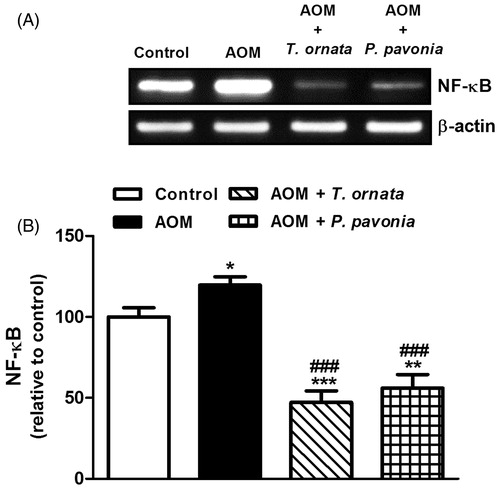
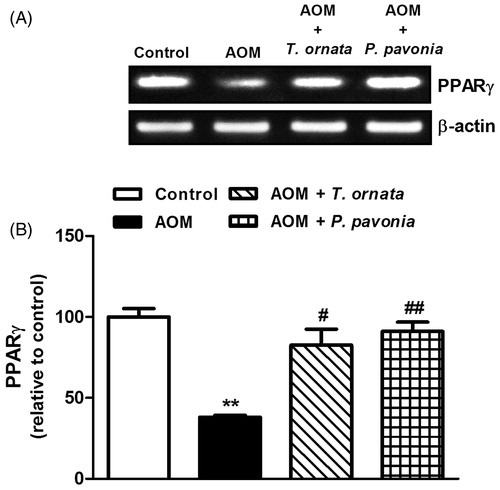
Figure 5. PCR analysis of liver PPARγ in control, AOM and AOM mice treated with T. ornata and P. pavonia. (A) Gel photograph depicting representative PPARγ and β-actin PCR products. (B) Corresponding densitometric analysis of the PCR products. Data are expressed as mean ± SEM. **p < 0.01 versus control and #p < 0.05, ##p < 0.01 versus AOM. PPARγ, peroxisome proliferator activated receptor gamma; AOM, azoxymethane; T. ornata, Turbinaria ornata; P. pavonia, Padina pavonia; SEM, standard error of the mean.