Figures & data
Figure 1. HPLC fingerprint of triterpene acids isolated from P. cocos. The peaks were identified as (1) polyporenic acid C, (2) pachymic acid, (3) dehydrotrametenolic acid and (4) trametenolic acid.
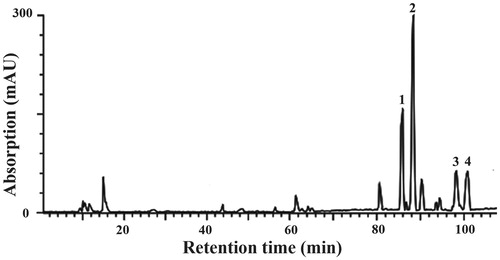
Figure 2. Effects of TTP on locomotor activity in mice. (A) Total mobile counts. (B) Total rearing counts. DZP was used as a positive control. Mice were divided into six groups (n = 10): control group (normal saline, 20 mL/kg, i.g.), positive group (DZP, 1 mg/kg) and four experimental groups (TTP at dose of 20, 80 and 160 mg/kg, respectively). Values are means ± SD (n = 20), *p < 0.05, **p < 0.01 when compared with the control.
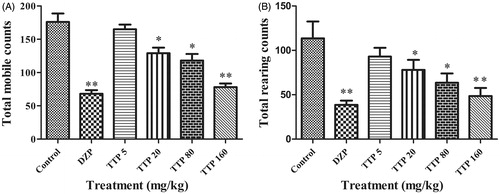
Figure 3. Effects of TTP on Rota-rod test in mice. Mice were divided into five groups (n = 10): control group (normal saline, 20 mL/kg, i.g.) and four experimental groups (TTP at dose of 5, 20, 80 and 160 mg/kg, respectively). Values are means ± SD (n = 20), *p < 0.05, **p < 0.01 when compared with the control.
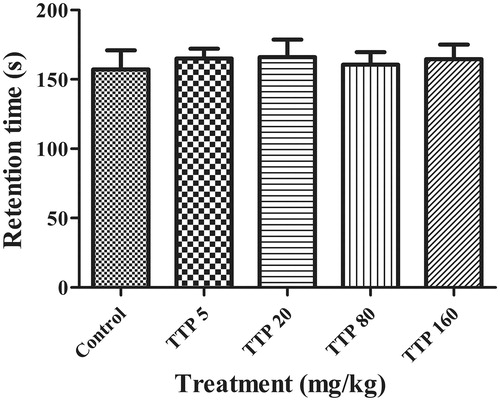
Figure 4. Effects of TTP on the analysis of pentobarbital sodium-induced sleeping time in mice. (A) Duration of mice sleep. (B) The onset of mice sleep. DZP was used as a positive control. Mice were divided into six groups (n = 10): control group (normal saline, 20 mL/kg, i.g.), positive group (DZP, 1 mg/kg) and four experimental groups (TTP at dose of 5, 20, 80 and 160 mg/kg, respectively). Values are means ± SD (n = 20), *p < 0.05, **p < 0.01 when compared with the control.
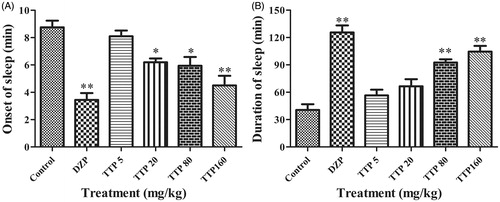
Table 1. Effect of TTP on tonic seizures induced by maximal electroshock in male mice (n = 20).
Table 2. Effect of TTP on pentylentertrazole (PTZ)-induced seizures in mice (n = 20).
Figure 5. Effects of TTP on the Asp, GABA, Glu and Gly level of mice brain. (A) The contents of Glu. (B) The contents of GABA. (C) The contents of Asp. (D) The contents of Glu. Six groups (n = 10) of mice were treated as follows: normal group treated with no PTZ (normal saline, 20 mL/kg), control group (normal saline, 20 mL/kg) and four experimental TTP groups (5, 20, 80 and 160 mg/kg). Values are means ± SD (n = 20), *p < 0.05, **p < 0.01 when compared with the control.
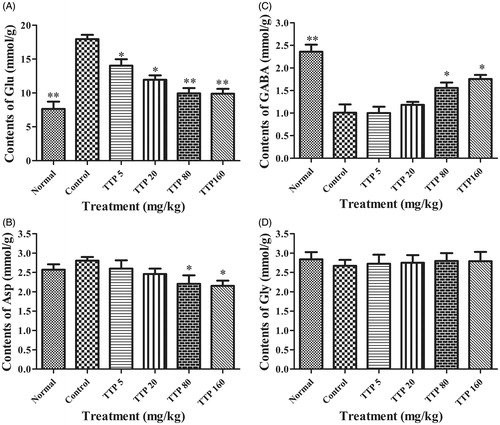
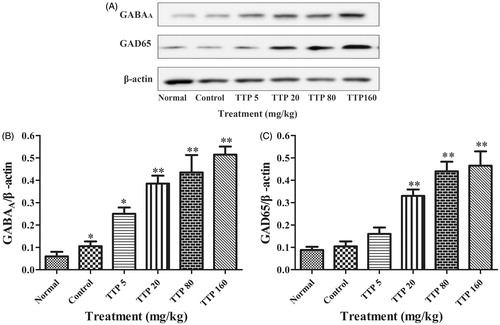
Figure 6. Effects of TTP on GAD65 and GABAA expression in the brain of epileptic rats. (A) Western blot analysis of expressions of GAD65 and GABAA. β-Actin was considered as an internal control. (B) Quantitation of GAD65 expression in (A). (C) Quantitation of GABAA expression in (A). Six groups (n = 10) of rat were treated as follows: normal group without any treatment, control group (normal saline, 20 mL/kg), and four experimental TTP groups (5, 20, 80 and 160 mg/kg). Values are means ± SD (n = 8), *p < 0.05, **p < 0.01 when compared with the control.