
Figures & data
Table 1. Summary of phytochemical constituents of Albizia lebbeck seed extracts.
Figure 1. Dose-dependent inhibition of protease activity of ECV by ALME: reaction mixture (1 mL) contained 0.4 ml of casein (2% in 0.2 M Tris-HCl buffer, pH 8.5), incubated with 25 μg of ECV + different concentrations of ALME ranging from 1:1 to 1:100 w/w for 2.5 h at 37 °C. Data represents mean ± SD (n = 3). *p < 0.05, **p < 0.01 and ***p < 0.001 compared with ECV.
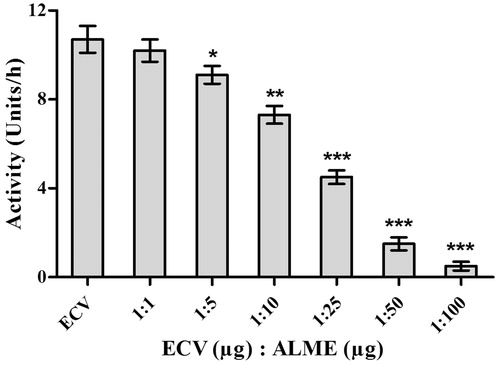
Figure 2. Inhibition of gelatinolytic activity of ECV by ALME: gelatin (0.08%) was incorporated into the 10% SDS polyacrylamide resolving gel matrix. ECV (10 μg) alone and ECV pre-incubated with ALME for 15 min was loaded onto separate wells. Lanes, (A) 10 μg ECV; (B) 1:100 [ECV (μg): ALME (μg)]. Data represent mean ± SD (n = 3). ***p < 0.001 compared with ECV.
![Figure 2. Inhibition of gelatinolytic activity of ECV by ALME: gelatin (0.08%) was incorporated into the 10% SDS polyacrylamide resolving gel matrix. ECV (10 μg) alone and ECV pre-incubated with ALME for 15 min was loaded onto separate wells. Lanes, (A) 10 μg ECV; (B) 1:100 [ECV (μg): ALME (μg)]. Data represent mean ± SD (n = 3). ***p < 0.001 compared with ECV.](/cms/asset/eceaaf9c-8eb8-4dda-b904-2fa8131d8616/iphb_a_1171882_f0002_b.jpg)
Figure 3. Dose-dependent inhibition of plasma clot hydrolyzing activity of ECV by ALME: washed plasma clot was incubated with 10 μg of ECV + varying concentrations of ALME in 10 mM Tris-HCl pH 7.6 for 3 h and cleavage pattern of the plasma clot was analyzed using 10% SDS-PAGE. (A) Plasma clot alone; (B) and (G) plasma clot +10 μg ECV; (C)–(F) 1:10, 1:25, 1:50, 1:100 ALME (w/w), respectively.
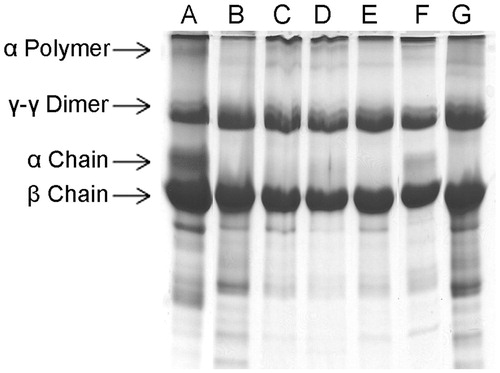
Figure 4. Haemorrhage inhibition studies of ECV using ALME: Mice were injected intradermal with constant 3 μg of ECV and various concentrations of ALME (5 min post ECV injection). After 3 h mice were sacrificed and haemorrhagic spot appeared on the inner surface was measured using graph sheet and the results were expressed in mm2. (A) 3 μg ECV; (B)–(D) 1:10, 1:25, 1:50 ALME (w/w), respectively; (E) saline; (F) ALME alone. Data represent mean ± SD (n = 3). ***p < 0.001 compared with ECV.
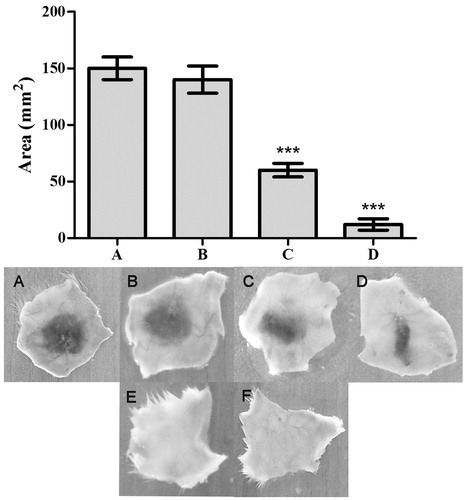
Figure 5. Myotoxicity inhibition studies of ECV using ALME: mice were co-injected with 5 μg of ECV + different concentrations of ALME (simultaneously). After 3 h mice were sacrificed and serum CK and LDH levels were assayed using AGAPPE kit. Data represent mean ± SD (n = 3). *p < 0.05, **p < 0.01 and ***p < 0.001 compared with ECV.
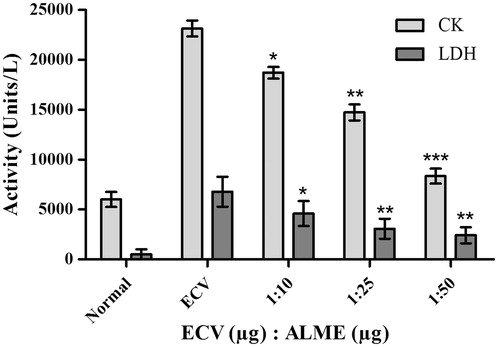
Figure 6. Dose-dependent inhibition of pro-coagulant activity of ECV by ALME: ECV (1 μg) was pre-incubated with ALME (1:1–1:100 w/w) for 15 min at 37 °C. It was added to 200 μL of citrated human plasma containing 20 μL Tris-HCl buffer (10 mM, pH 7.4) and time taken for the formation of visible clot was recorded. To confirm the specificity of inhibition of ECV metalloprotease, thrombin time was done. Data represent mean ± SD (n = 3). *p < 0.05, **p < 0.01 and ***p < 0.001 compared with ECV.
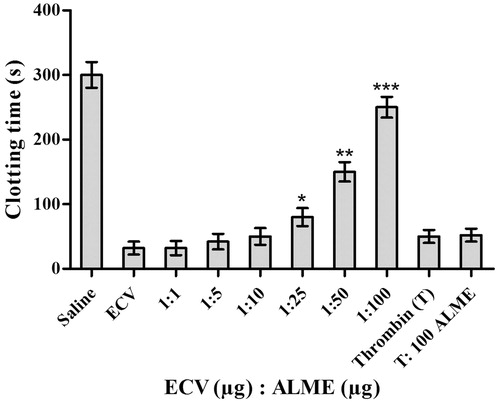
Figure 7. Dose-dependent inhibition of fibrinogenolytic activity of ECV by ALME: Fibrinogen (60 μg) was incubated with 2 μg of ECV + varying concentrations of ALME in 10 mM Tris-HCl pH 7.6 for 3 h and cleavage pattern was analyzed using 10% SDS-PAGE. (A) Fibrinogen alone; (B) fibrinogen +2 μg ECV; (C)–(F) 1:10, 1:25, 1:50 and 1:100 ALME (w/w), respectively.
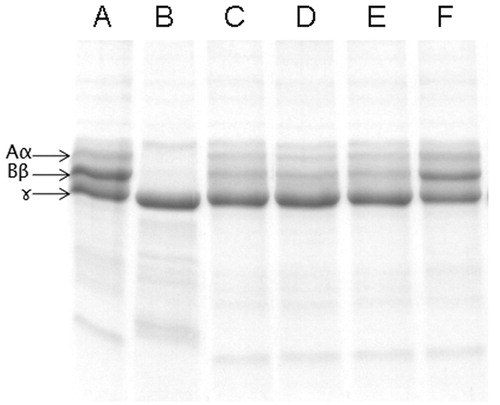
Figure 8. Dose-dependent inhibition of hyaluronidase activity of ECV by ALME: Reaction mixture (0.5 mL) contained 50 μL of hyaluronic acid (1 μg/μL in 0.1 M sodium acetate buffer containing 0.15 M NaCl, pH 8.5) incubated with 100 μg of ECV + different concentrations of ALME ranging from 1:1 to 1:100 w/w for 2.5 h at 37 °C. Data represent mean ± SD (n = 3). *p < 0.05, **p < 0.01 and ***p < 0.001 compared with ECV.
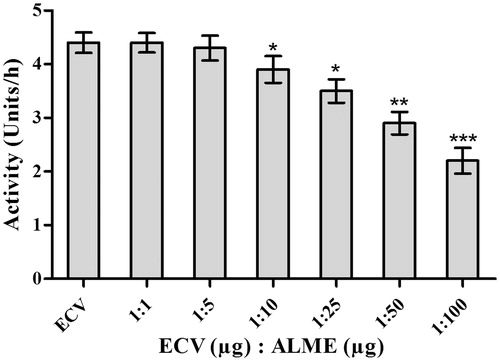
Figure 9. IC50/ED50 of antidote ALME against ECV: For the calculation of IC50/ED50 of ALME, activity (%) was plotted on the y-axis and ALME concentration in μg was plotted on the x-axis. To this plot, straight-line equation was obtained using MS-Excel (y = mx + c), in which y = activity (%) and x = ALME (μg). For IC50/ED50, we have substituted y = 50 and calculated x (IC50/ED50). (A) IC50 value of ECV protease; (B) IC50 value of ECV hyaluronidase; (C) ED50 value of haemorrhage neutralization; (D) and (E) ED50 value of myotoxicity neutralization (CK and LDH, respectively).
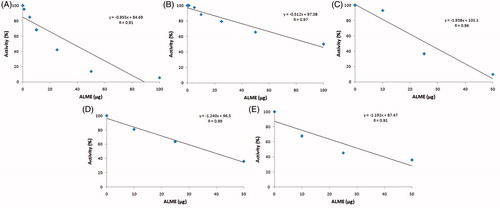
Figure 10. Inhibition of hyaluronidase activity of ECV by ALME: Hyaluronic acid was incorporated into the SDS polyacrylamide resolving gel matrix (0.05%). ECV (100 μg) and ECV pre-incubated with ALME for 15 min was loaded onto separate wells. (A) 100 μg ECV; (B) 1:100 [ECV (μg): ALME (μg)]. Data represent mean ± SD (n = 3). ***p < 0.001 compared with ECV.
![Figure 10. Inhibition of hyaluronidase activity of ECV by ALME: Hyaluronic acid was incorporated into the SDS polyacrylamide resolving gel matrix (0.05%). ECV (100 μg) and ECV pre-incubated with ALME for 15 min was loaded onto separate wells. (A) 100 μg ECV; (B) 1:100 [ECV (μg): ALME (μg)]. Data represent mean ± SD (n = 3). ***p < 0.001 compared with ECV.](/cms/asset/8c8bf1fb-e58d-46a2-88b8-372150f195cf/iphb_a_1171882_f0010_b.jpg)