Figures & data
Figure 1. HPLC chromatogram of flavonoid and phenolic compounds in H. cheirifolia methanol extract.
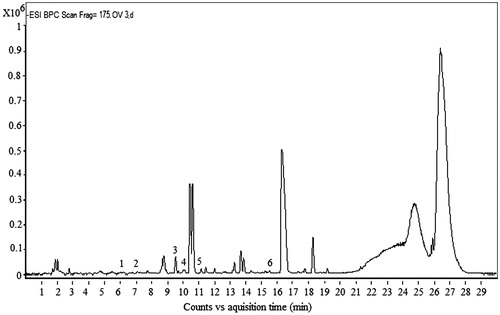
Table 1. Compounds determined by HPLC-TOF/MS in H. cheirifolia methanol extract.
Figure 2. Effect of H. cheirifolia methanol extract on croton oil-induced ear oedema. Mice were treated with 2 mg/ear of methanol extract (Met. E) or 0.5 mg/ear of indomethacin (IND). Control group received sterile saline solution only. Oedema is expressed as mean thickness of ears before and 6 h after croton oil application. Values are expressed as means ± SEM (n = 6). ***p < 0.001; NS: not significant versus control.
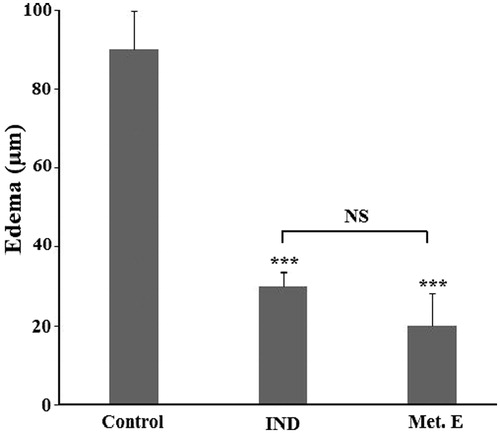
Figure 3. Time course of carrageenan-induced rat paw oedema. The oedema was induced by sub-plantar injection of 0.1 mL of carrageenan 1% in rat pre-treated orally with 200 and 400 mg/kg of methanol extract (Met. E), 100 mg/kg body weight of aspirin or vehicle (control). Each value represents the percentage increase in volume of the injected paw at different times after injection of carrageenan compared with the control group set to 100%. Values are means ± SEM of six animals for each group.
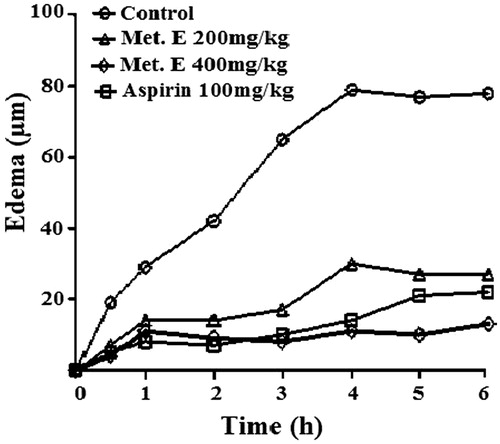
Table 2. Effect of H. cheirifolia methanol extract on granuloma tissue formation.
Figure 4. Effect of H. cheirifolia methanol extract on leukocytes infiltrated into air pouch exudate. The pouch inflammation was induced by 0.1 mL of carrageenan (1%). One hour after the induction of inflammation, mice were treated by 1 mg/pouch of the extract or 0.15 mg/pouch of indomethacin. The comparison was made with respect to the control group (without treatment). Values are means ± SEM (n = 6). ***p <0.001; NS: not significant versus control.
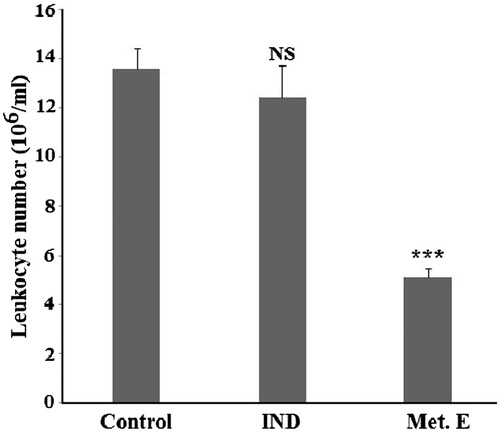
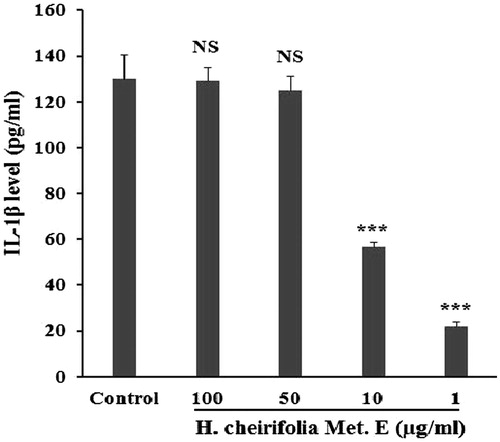
Figure 5. Effect of H. cheirifolia methanol extract (Met. E) on TNF-α produced by Con A stimulated PBMCs. Cells (2 × 10⁵ cells/mL) were seeded in a 24-well plate and activated for 30 min with 5 μg/mL Con A after the treatment with different concentrations of H. cheirifolia methanol extract (100, 50, 10 and 1 μg/mL). Cultures were incubated in a humidified atmosphere at 37 °C and 5% CO2 overnight. After centrifugation, supernatants were then harvested for analysis by an ELISA assay. Untreated cells with the extract were used as the control. Data present the mean concentration of triplicates ± SEM. ***p < 0.001, *p < 0.05; NS: not significant versus control.
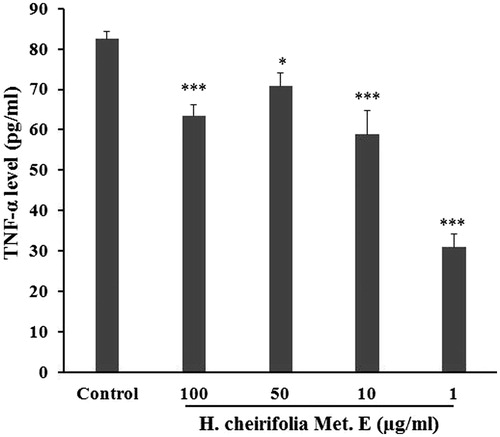
Figure 6. Effect of H. cheirifolia methanol extract (Met. E) on IL-8 produced by Con A stimulated PBMCs. The experimental conditions were essentially the same as those in Figure 5. Data are shown as the mean concentration of triplicates ± SEM. ***p < 0.001; NS: not significant versus control.