Figures & data
Figure 1. HPLC chromatogram. (A) Ethanol solvent (blank), (B) α-mangostin standard solution (10 μg/mL) with retention time (tR) 6.016 min, (C) γ-mangostin standard solution (10 μg/mL) with retention time (tR) 3.207 min, (D) GM-EtOH, the ethanolic G. mangostana extract with the peak of α- and γ-mangostin and (E) GM-MeOH, the methanolic G. mangostana extract with the peak of α- and γ-mangostin.
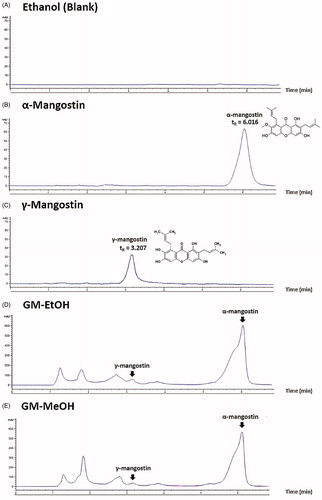
Table 1. Contents of chemical markers in the G. mangostana crude extract.
Table 2. Inhibition zone, MIC and MBC values of the G. mangostana crude extract against MSSA and MRSA.
Figure 2. Effects of GM-EtOH on TEWL in the tape stripping model in mice. TEWL was measured on the back of the mice as described in the method (n = 9–10). Control, non-infected mice with the tape stripping induced wound; NT, MRSA-infected wound in mice with no treatment; Base, MRSA-infected wound in mice treated with 100 μL of a 10% ethanol in propylene glycol solution; GM-EtOH, MRSA-infected wound in mice treated with 100 μL of a 10% GM-EtOH in a 10% ethanol in propylene glycol solution; Erythromycin, MRSA-infected wound in mice treated with 100 μL of a 4% commercial erythromycin gel; Gentamicin, MRSA-infected wound in mice treated with 100 μL of a 0.1% commercial gentamicin cream. *p < 0.001 versus control on the same day using one-way ANOVA followed by LSD post hoc test.
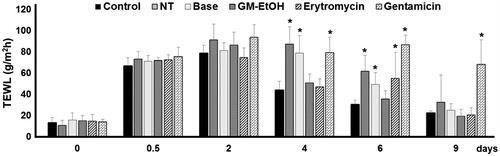
Figure 3. Effects of GM-EtOH and α-mangostin on TEWL in the tape stripping model in mice. TEWL was measured on the back of the mice as described in the method (n = 7–10). Control, non-infected mice with the tape stripping induced wound; NT, MRSA-infected wound in mice with no treatment; GM-EtOH, MRSA-infected wound in mice treated with 100 μL of a 10% GM-EtOH in a 10% ethanol in propylene glycol solution; Alpha-MGS, MRSA-infected wound in mice treated with 100 μL of a 1.32% α-mangostin in a 10% ethanol in propylene glycol solution; Erythromycin, MRSA-infected wound in mice treated with 100 μL of a 1.32% erythromycin in a 10% ethanol in propylene glycol solution. *p < 0.001 versus control on the same day using one-way ANOVA followed by LSD post hoc test.
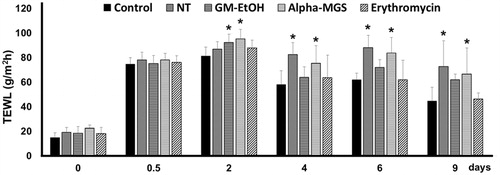
Figure 4. The effect of GM-EtOH on** the number of S. aureus colonies. MRSA was swabbed from the wound of the mouse back to culture on the MSA plate and number of colonies were counted at 24 h after the incubation (n = 9-10). Control, non-infected mice with the tape stripping induced wound; NT, MRSA-infected wound in mice with no treatment; Base, MRSA-infected wound in mice treated with 100 μL of a 10% ethanol in propylene glycol solution; GM-EtOH, MRSA-infected wound in mice treated with 100 μL of a 10% GM-EtOH in a 10% ethanol in propylene glycol solution; Erythromycin, MRSA-infected wound in mice treated with 100 μL of a 4% commercial erythromycin gel; Gentamicin, MRSA-infected wound in mice treated with 100 μL of a 0.1% commercial gentamicin cream. *p < 0.001 versus control and #p < 0.001 versus GM-EtOH on the same day using one-way ANOVA followed by LSD post hoc test.
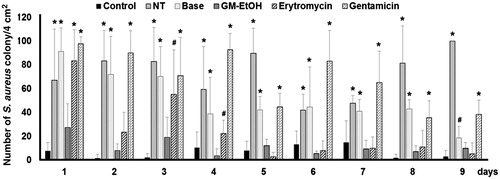
Figure 5. The effect of GM-EtOH and α-mangostin in the number of MRSA colonies. MRSA was swabbed from the wound of the mouse back and diluted to 2 mL of NSS before culturing on the MSA containing oxacillin (6 μg/mL) plate. The number of colonies was counted at 24 h after the incubation (n = 7–10). Control, non-infected mice with the tape stripping induced wound; NT, MRSA-infected wound in mice with no treatment; GM-EtOH, MRSA-infected wound in mice treated with 100 μL of a 10% GM-EtOH in a 10% ethanol in propylene glycol solution; Alpha-MGS, MRSA-infected wound in mice treated with 100 μL of a 1.32% α-mangostin in a 10% ethanol in propylene glycol solution; Erythromycin, MRSA-infected wound in mice treated with 100 μL of a 1.32% erythromycin in a 10% ethanol in propylene glycol solution. *p < 0.05 versus control and #p < 0.05 versus GM-EtOH on the same day using one-way ANOVA followed by LSD post hoc test.
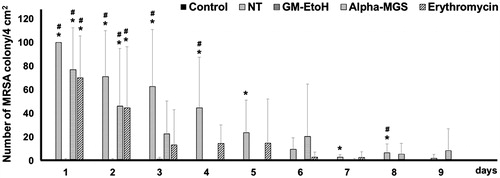
Figure 6. The effect of GM-EtOH on the wound-appearance. The photograph of the wound was recorded daily (n = 9–10) after the treatments. The figure showed the wound-appearance on the last day of observation (the ninth day). Control, non-infected mice with the tape stripping induced wound; NT, MRSA-infected wound in mice with no treatment; Base, MRSA-infected wound in mice treated with 100 μL of a 10% ethanol in propylene glycol solution; GM-EtOH, MRSA-infected wound in mice treated with 100 μL of a 10% GM-EtOH in a 10% ethanol in propylene glycol solution; Erythromycin, MRSA-infected wound in mice treated with 100 μL of a 4% commercial erythromycin gel; Gentamicin, MRSA-infected wound in mice treated with 100 μL of a 0.1% commercial gentamicin cream.
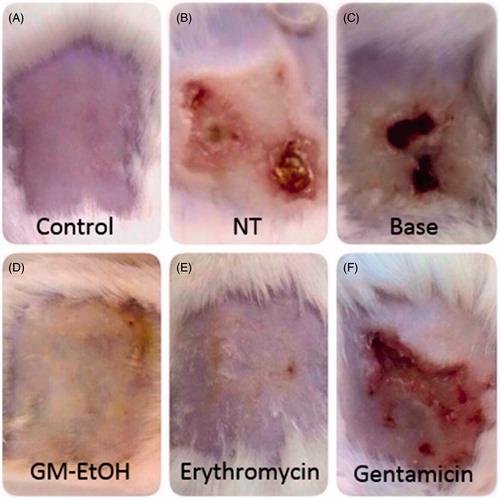
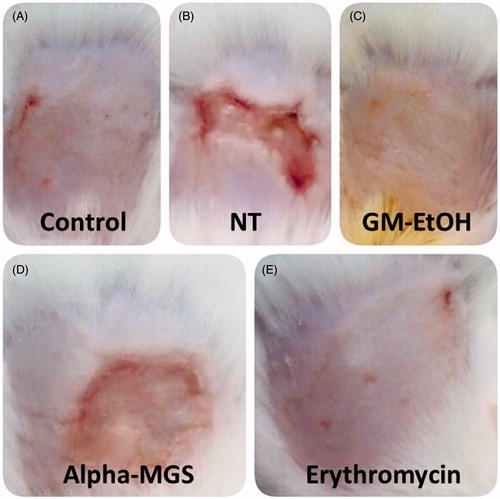
Figure 7. The effect of GM-EtOH and α-mangostin on the wound-appearance. The photograph of the wound was recorded daily (n = 7–10) after the treatments. The figure showed the wound-appearance on the last day of observation (the ninth day). Control, non-infected mice with the tape stripping induced wound; NT, MRSA-infected wound in mice with no treatment; GM-EtOH, MRSA-infected wound in mice treated with 100 μL of a 10% GM-EtOH in a 10% ethanol in propylene glycol solution; Alpha-MGS, MRSA-infected wound in mice treated with 100 μL of a 1.32% α-mangostin in a 10% ethanol in propylene glycol solution; Erythromycin, MRSA-infected wound in mice treated with 100 μL of a 1.32% erythromycin in a 10% ethanol in propylene glycol solution.