Figures & data
Figure 1. Chromatogram showing bands of (A) flavonoids derivatized with NP reagent and (B) tannins derivatized with vanillin sulphuric acid reagent.
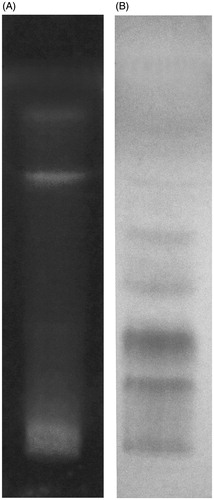
Figure 2. Effect of MEFP on paw volume in CFA-induced arthritic rats. The values are expressed as mean ± SD. p < 0.05 was considered significant with respect to arthritic control group (*p < 0.05; **p < 0.01; ***p < 0.001).
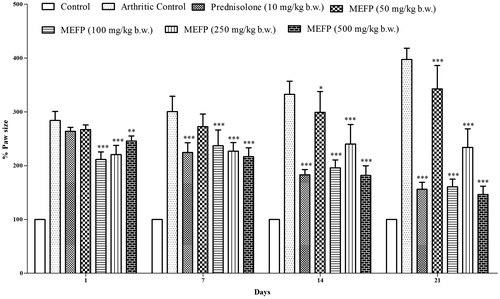
Figure 3. Effect of MEFP on SOD levels in liver, kidney and spleen. The values are expressed as mean ± SD. p < 0.05 was considered significant with respect to arthritic control group (*p < 0.05; **p < 0.01; ***p < 0.001).
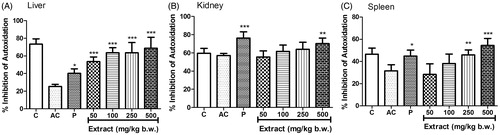
Figure 4. Effect of MEFP on CAT levels in liver, kidney and spleen. The values are expressed as mean ± SD. p < 0.05 was considered significant with respect to arthritic control group (*p < 0.05; ***p < 0.001).
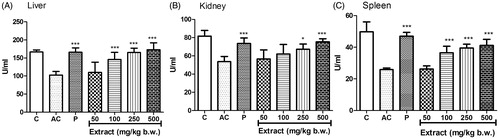
Figure 5. Effect of MEFP on GPx levels in liver, kidney and spleen. The values are expressed as mean ± SD. p < 0.05 was considered significant with respect to arthritic control group (*p < 0.05; **p < 0.01; ***p < 0.001).
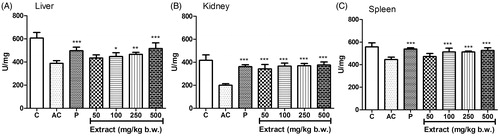
Figure 6. Effect of MEFP on CRP levels. The values are expressed as mean ± SD. p < 0.05 was considered significant with respect to arthritic control group. (**p < 0.01; ***p < 0.001).
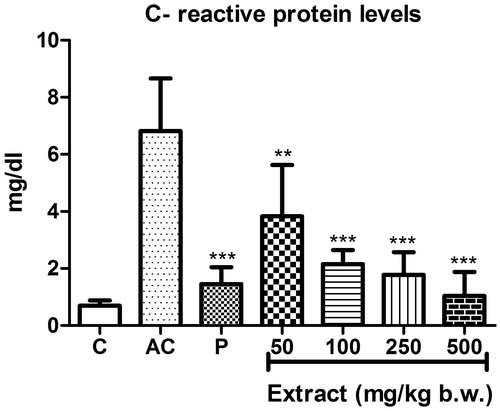
Figure 7. Effect of MEFP on PGE2 levels. The values are expressed as mean ± SD. p < 0.05 was considered significant with respect to arthritic control group (**p < 0.01; ***p < 0.001).
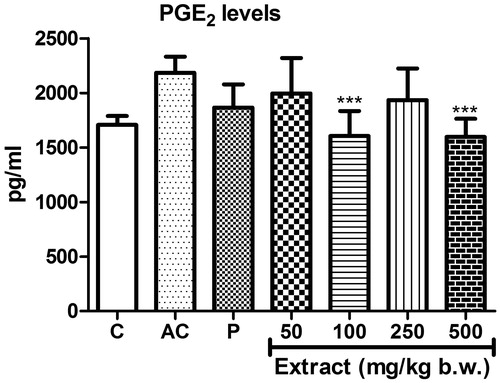
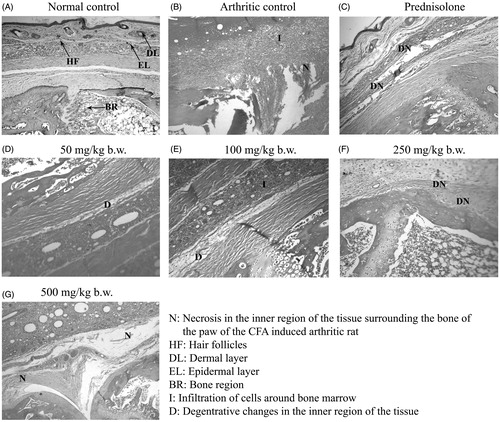
Figure 8. Parameters analysed in histopathology of paw region.