Figures & data
Figure 1. Phenotype of moDC exposed to the ADE. (A) Activation profile (CD86, CD83 and HLA-DR surface expression) of moDC exposed for 24 h to either LPS, medium alone (NT), or the ADE at 60 μg/mL. Similar results were obtained in three independent experiments. (B) Levels of secreted IL-10 (pg/mL) and IL-12 (pg/mL) by moDC exposed to medium alone (NT), S. epidermidis secretome (SE), ADE as indicated (μg/mL) and LPS. Mean values with SEM are shown, p values less than 0.05 were considered as significant, N = 12.
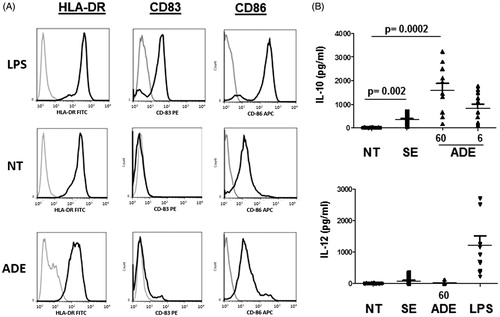
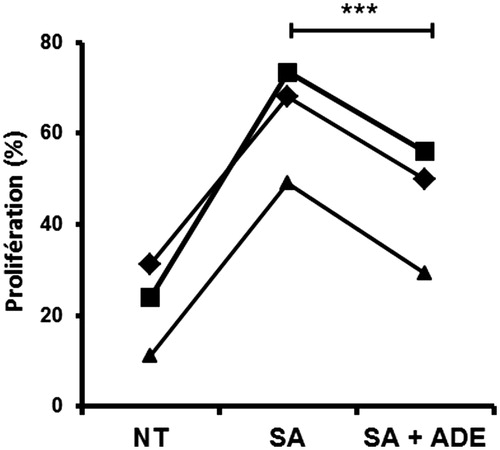
Figure 2. ADE counteracts the effect of S. aureus secretome on CD4 + T cells proliferation. MoDC were exposed for 24 h to either medium alone (NT), or S. aureus secretome (SA) alone, or a mixture of (SA) with ADE at 60 μg/mL. Then, moDC were co-cultured with CFSE-labelled allogeneic CD4+ T cells. Proliferation of T cells was quantified by flow cytometry (%). Paired t-test, ***p < 0.001, N = 3.