217
Views
2
CrossRef citations to date
0
Altmetric
Research Article

Size distribution of embolic material produced at aortic cross-clamp manipulation

, &
Pages 367-372 | Received 05 Feb 2010, Accepted 10 Jun 2010, Published online: 11 Nov 2010

Figures & data

Figure 1. Schematic illustration of the used evaluation methods; macroscopic (left panel) and microscopic (right panel), respectively. With the macroscopic approach, the entire deposit was scanned in one view for measurement of particle count and size. With the microscopic approach, three randomly selected views were scanned and measured. The total particle output was extrapolated from the known area of the microscopic view in relation to the entire area of the deposit.
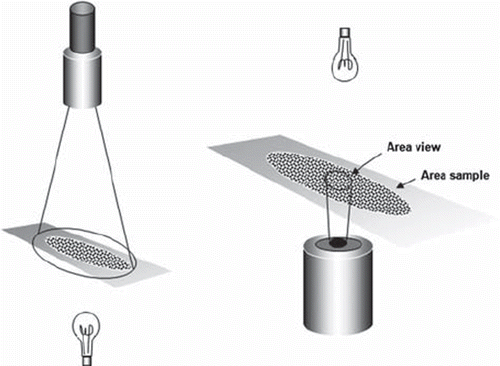
Figure 1. Schematic illustration of the used evaluation methods; macroscopic (left panel) and microscopic (right panel), respectively. With the macroscopic approach, the entire deposit was scanned in one view for measurement of particle count and size. With the microscopic approach, three randomly selected views were scanned and measured. The total particle output was extrapolated from the known area of the microscopic view in relation to the entire area of the deposit.

Figure 2. Logarithmically transformed particle output produced at aortic cross-clamping with subdivision into diameter intervals. Mean of Log10 values with standard errors indicated (n=27).
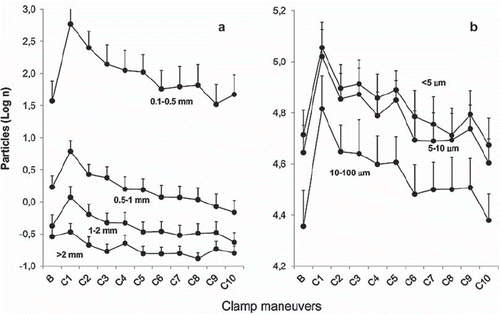
Figure 2. Logarithmically transformed particle output produced at aortic cross-clamping with subdivision into diameter intervals. Mean of Log10 values with standard errors indicated (n=27).

Table I. Statistical output.
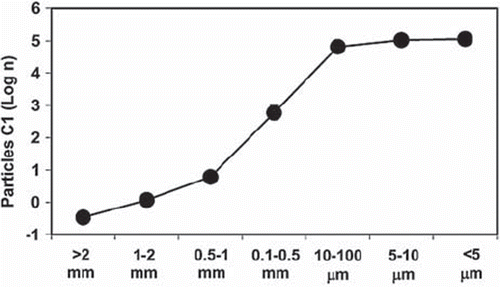
Figure 3. Logarithmically transformed particle numbers as a function of particle size. Mean of Log10 values are presented (n=27). Standard error bars are indicated but escape detection due to small spread. Spearman's rank correlation test was applied (p<0.010).

Figure 3. Logarithmically transformed particle numbers as a function of particle size. Mean of Log10 values are presented (n=27). Standard error bars are indicated but escape detection due to small spread. Spearman's rank correlation test was applied (p<0.010).

Reprints and Corporate Permissions

Please note: Selecting permissions does not provide access to the full text of the article, please see our help page How do I view content?

To request a reprint or corporate permissions for this article, please click on the relevant link below:

Academic Permissions

Please note: Selecting permissions does not provide access to the full text of the article, please see our help page How do I view content?

Obtain permissions instantly via Rightslink by clicking on the button below:

If you are unable to obtain permissions via Rightslink, please complete and submit this Permissions form. For more information, please visit our Permissions help page.