Figures & data
Table I. Patient characteristics of all patients as well as the comparison of controls vs. high biomarker groups (presented as p-values in the biomarker columns).
Table II. Procedural data of all patients as well as the comparison of controls vs. high biomarker groups.
Table III. Temporal pattern of the cardiac biomarkers before and after angioplasty.
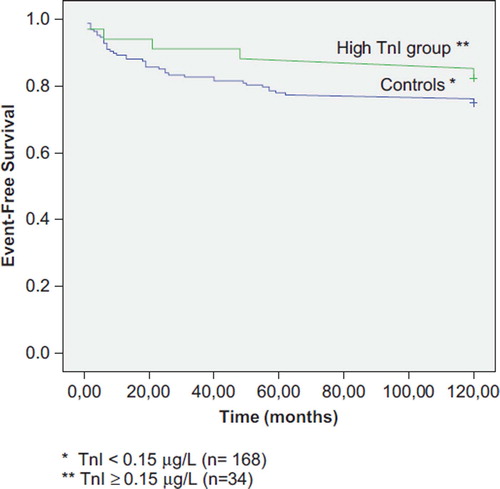
Figure 1. Kaplan-Meier plot of event-free survival (all patients, n = 202). P-value = 0.05 (log-rank test).
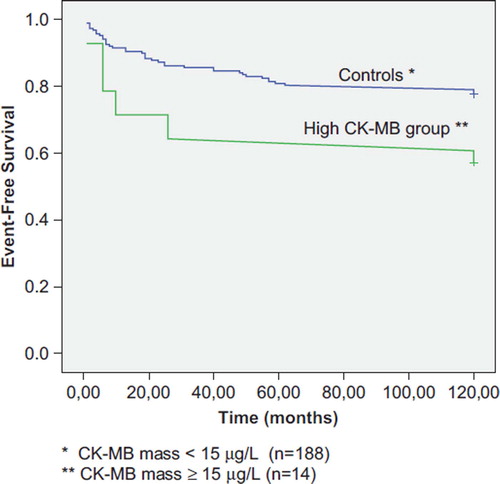
Figure 2. Kaplan-Meier plot of event-free survival (all patients, n = 202). P-value = 0.22 (log-rank test).
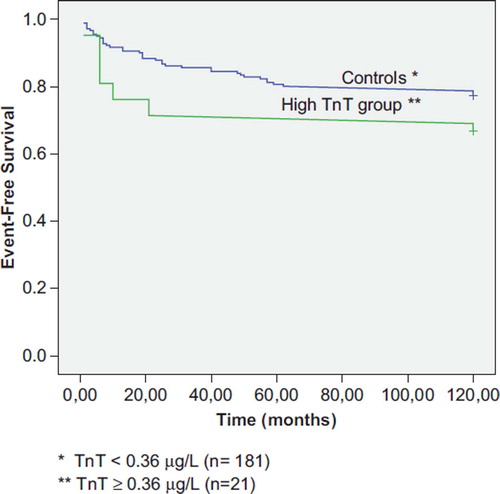
Figure 3. Kaplan-Meier plot of event-free survival (all patients, n = 202). P-value = 0.34 (log-rank test)