Figures & data
Figure 1. The effect of combination therapy on body weight. C, control group; PH, PH group; T, tadalafil group; S, simvastatin group; TS, combination group. The data are presented as means ± SEMs. #p < 0.01, the PH group vs. the control group; *p < 0.01, the therapy groups vs. the control group; †p < 0.05 the therapy groups vs. the PH group.
Table I. The effect of combination therapy on the mean systemic arterial pressure and heart rate.
Figure 2. A comparison of the pulmonary hemodynamics and right ventricular hypertrophy across the experimental groups (mean ± SD). mPAP, mean pulmonary arterial pressure; RVSP, right ventricular systolic pressure; RVHI, the ratio of the right ventricular weight to the left ventricular + septal weight. # p < 0.001 compared with the control group; *p < 0.01 compared with the PH group; †p < 0.05 compared with the tadalafil group, ‡p < 0.05 compared with the simvastatin group.
Figure 3. Photomicrographs of the pulmonary arteries in the control group (A), PH group (B), simvastatin group (C), tadalafil group (D) and combination group (E) (× 400; HE staining). A histological examination of the lung revealed a marked increase in pulmonary arterial wall thickening in the PH group. This increase in thickening was attenuated in the simvastatin, tadalafil and combination groups.
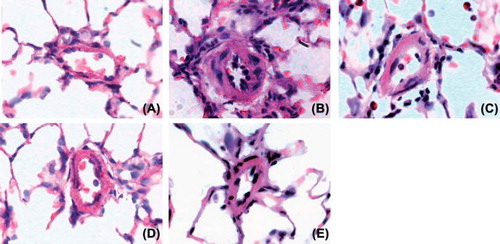
Figure 4. The effect of combination therapy on pulmonary artery remodeling. C, control group; PH, PH group; T, tadalafil group; S, simvastatin group; TS, combination group. The data are presented as means ± SEMs. #p < 0.001 vs. the control group; *p < 0.05 vs. the PH group.
Figure 5. The effect of combination therapy on lung IL-6 levels and the perivascular score. C, control group; P, PH group; T, tadalafil group; S, simvastatin group; TS, combination group. The data are presented as means ± SEMs. #p < 0.001 vs. the control group; *p < 0.05 vs. the PH group; †p < 0.05 vs. the tadalafil group; ‡p < 0.05 vs. the simvastatin group.