756
Views
14
CrossRef citations to date
0
Altmetric
Research Article

Effect of selenium and Q10 on the cardiac biomarker NT-proBNP

, , &
Pages 281-288 | Received 29 Jan 2013, Accepted 22 Jun 2013, Published online: 30 Jul 2013

Figures & data

Figure 1. Flow chart of the study.

Figure 1. Flow chart of the study.

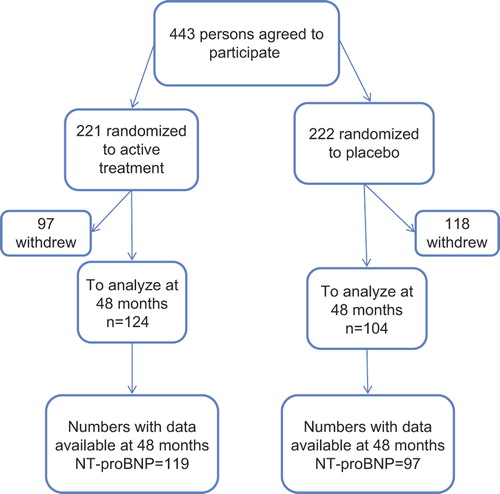
Table I. Background characteristics of the studied population who had plasma values of NT-proBNP collected at both baseline and at the end of the study (i.e., 48 months) and in relation to active substance or placebo.

Table II. Description of participants (n = 211) with plasma values of NT-proBNP collected at both baseline and 48 months according to baseline quintiles of NT-proBNP.

Table III. Ejection fraction distributed into the different quintiles of NT-proBNP in the total study population (n = 443).

Figure 2. (A) Analysis of the interaction between group (active substance or placebo) and follow-up (baseline or 48 months)and with NT-proBNP as outcome measure (logarithmic transformed) according to the quintile 1 of baseline NT-proBNP (NT-proBNP 15 ng/L-104 ng/L). Two-way ANOVA, F (1, 41) = 0.210, p = 0.65. (B) Analysis of the interaction between group (active substance or placebo) and follow-up (baseline or 48 months)and with NT-proBNP as outcome measure (logarithmic transformed) according to the quintile 2 of baseline NT-proBNP (NT-proBNP 104.01–149.80 ng/L). Two-way ANOVA, F (1, 39) = 2.23, p = 0.14. (C) Analysis of the interaction between group (active substance or placebo) and follow-up (baseline or 48 months)and with NT-proBNP as outcome measure (logarithmic transformed) according to the quintile 3 of baseline NT-proBNP (NT-proBNP 149.81–227 ng/L). Two-way ANOVA, F (1, 42) = 4.25, p = 0.045. (D) Analysis of the interaction between group (active substance or placebo) and follow-up (baseline or 48 months)and with NT-proBNP as outcome measure (logarithmic transformed) according to the quintile 4 of baseline NT-proBNP (NT-proBNP 227.01–395.40 ng/L). Two-way ANOVA, F (1, 39) = 1.60, p = 0.21. (E) Analysis of the interaction between group (active substance or placebo) and follow-up (baseline or 48 months)and with NT-proBNP as outcome measure (logarithmic transformed) according to the quintile 5 of baseline NT-proBNP (NT-proBNP 395.41–3083 ng/L). Two-way ANOVA, F (1, 40) = 0.00, p = 0.99. (F) Analysis of the interaction between group (active substance or placebo) and follow-up (baseline or 48 months) and with NT-proBNP as outcome measure (logarithmic transformed) according to the baseline quintiles 2–4 of NT-proBNP (NT-proBNP 104.01–395.40 ng/L). Two-way ANOVA, F (1, 124) = 7.95, p = 0.006.

Figure 2. (A) Analysis of the interaction between group (active substance or placebo) and follow-up (baseline or 48 months)and with NT-proBNP as outcome measure (logarithmic transformed) according to the quintile 1 of baseline NT-proBNP (NT-proBNP 15 ng/L-104 ng/L). Two-way ANOVA, F (1, 41) = 0.210, p = 0.65. (B) Analysis of the interaction between group (active substance or placebo) and follow-up (baseline or 48 months)and with NT-proBNP as outcome measure (logarithmic transformed) according to the quintile 2 of baseline NT-proBNP (NT-proBNP 104.01–149.80 ng/L). Two-way ANOVA, F (1, 39) = 2.23, p = 0.14. (C) Analysis of the interaction between group (active substance or placebo) and follow-up (baseline or 48 months)and with NT-proBNP as outcome measure (logarithmic transformed) according to the quintile 3 of baseline NT-proBNP (NT-proBNP 149.81–227 ng/L). Two-way ANOVA, F (1, 42) = 4.25, p = 0.045. (D) Analysis of the interaction between group (active substance or placebo) and follow-up (baseline or 48 months)and with NT-proBNP as outcome measure (logarithmic transformed) according to the quintile 4 of baseline NT-proBNP (NT-proBNP 227.01–395.40 ng/L). Two-way ANOVA, F (1, 39) = 1.60, p = 0.21. (E) Analysis of the interaction between group (active substance or placebo) and follow-up (baseline or 48 months)and with NT-proBNP as outcome measure (logarithmic transformed) according to the quintile 5 of baseline NT-proBNP (NT-proBNP 395.41–3083 ng/L). Two-way ANOVA, F (1, 40) = 0.00, p = 0.99. (F) Analysis of the interaction between group (active substance or placebo) and follow-up (baseline or 48 months) and with NT-proBNP as outcome measure (logarithmic transformed) according to the baseline quintiles 2–4 of NT-proBNP (NT-proBNP 104.01–395.40 ng/L). Two-way ANOVA, F (1, 124) = 7.95, p = 0.006.
Supplemental material

Supplementary Figures 1–3

Download PDF (207.7 KB)

Reprints and Corporate Permissions

Please note: Selecting permissions does not provide access to the full text of the article, please see our help page How do I view content?

To request a reprint or corporate permissions for this article, please click on the relevant link below:

Academic Permissions

Please note: Selecting permissions does not provide access to the full text of the article, please see our help page How do I view content?

Obtain permissions instantly via Rightslink by clicking on the button below:

If you are unable to obtain permissions via Rightslink, please complete and submit this Permissions form. For more information, please visit our Permissions help page.