Figures & data
Figure 1. Echocardiography taken during implantation. aVTI of at least three beats were averaged (A). Myocardial velocity curves obtained and Ts measured in each segment from 4-chamber view (B).
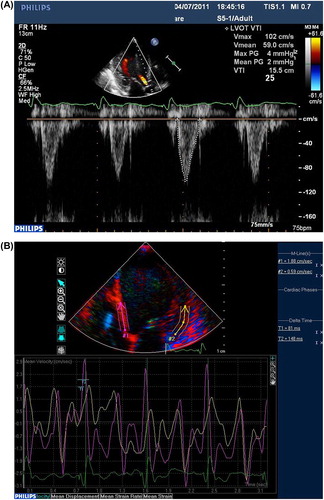
Figure 2. Interlead distance measured as DD, HD and VD on posteroanterior (A) and left lateral (B) fluoroscopy views.
Table I. Baseline characteristics of responders versus non-responders (n = 35).
Table II. Comparison of interlead distance with different RV lead positioning.
Table III. Comparison of interlead distance between responders and non-responders at 6-month follow-up.