Figures & data
Figure 1. The front of the BP card.
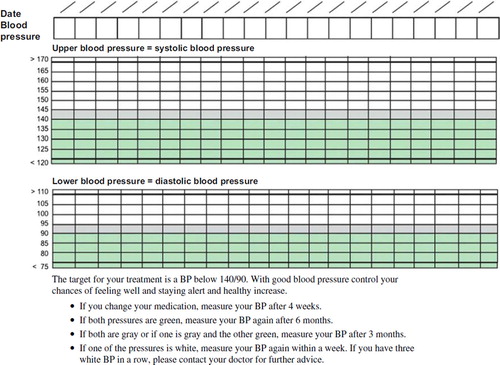
Figure 2. Information on the back of the BP card.
Table I. Data of the pilot study.
Table II. Comparative data at inclusion in main study (intervention groups I and IN and controls).
Table III. Primary effect variables. BP and BP differences before and after intervention and percentage reaching TBP in main study in intervention and control groups.
Table IV. Drug prescription and treatment-related health care contacts during study period in control and intervention groups.