Figures & data
Table I. Weight and hemodynamic data.
Figure 1. Effects of AMI and BMMNC transplantation. Increase in troponin concentration (A) and decrease in EF (B) reveals myocardial infarction in both groups 2 h after CX occlusion. After 21 days, the EF improvement was better in BMMNC group and BMMNC + MRI subgroup (control 5.6 percentage points vs. BMMNC 14.4). (C) The cytokine levels changed in different ways between the time points baseline vs. 24 h or 21 days in the two study groups.
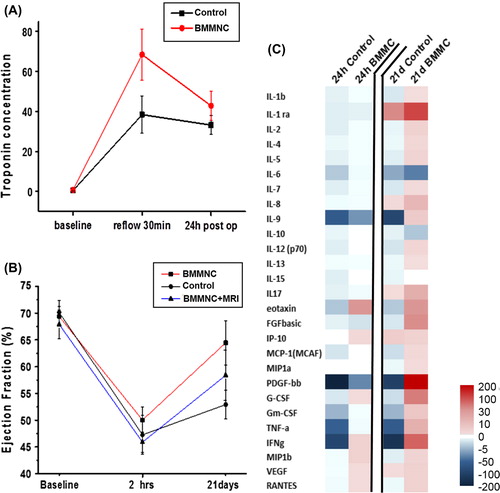
Figure 2. The change in the cytokine concentrations at 24 h and 21 days. Significant decrease in IL-9, PDGF, and IFN-γ levels in the control group at 24 h suggest that BMMNC administration may have an impact on the inflammation reaction after AMI. At 21 days, the significant changes in the cytokine concentrations appeared in the BMMNC group.
Table II. The mean cytokine concentrations at the baseline.
Figure 3. Cell detection using histology and MRI. (A) The left ventricle was divided into 16 segments based on the vascular territories in order to detect the injected BMMNC. The infarction area is designated by arrows. (B) BMMNCs were detected from the same segment area using MRI or histology (C–D) Hypointense area in MRI is interpreted as BMMNCs (arrows). The left ventricle has become thinner after 21 days due to AMI.
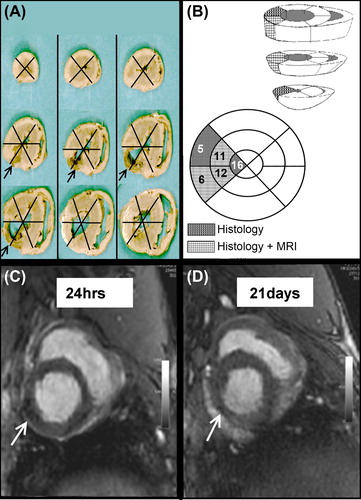
Table III. BMMCs detected using histology or MRI.
Table IV. The proportional (%) area of BMMCs on each segment.
Figure 4. Histological changes in myocardium after 3 weeks of AMI. (A) Mainly fibrosis (arrow heads) but also necrosis (arrows) and calcification (asterix) were observed in an injured area of both BMMNC group and control group animals. (B) Necrosis was detected in a few segments, but mainly there was granulation tissue with newly formed fibrosis (C) or fibrotic scar (D, E) Cartilage was also found in the myocardium of both controls and BMMNC group animals. (F) Prussian blue staining detected the SPIO-labeled BMMNCs. (A–E) H&E staining, scale bars 100 μm.
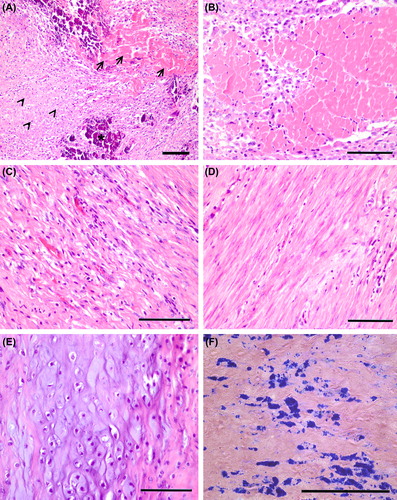
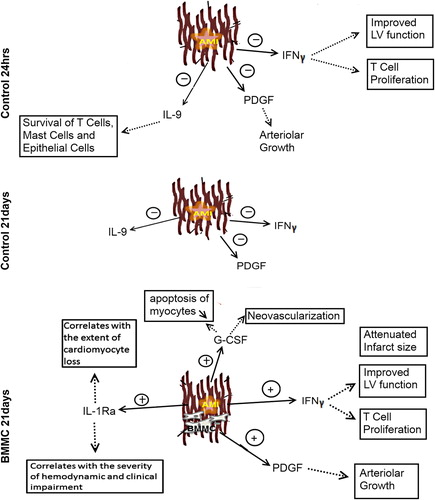
Figure 5. The major changes in the cytokine levels at 24 h and 21 days after AMI and the possible effects. The IL-9 and PDGF levels declined in both groups at 24 h. At 21 days, a more complex cytokine network was apparent in the BMMNC group. IL-1ra, PDGF, INF-γ, and G-CSF levels were elevated. Dotted line indicates the possible effect of the cytokine.