Figures & data
Figure 1. Viewport with strain curves from a patient with anteroapical infarction. Radial strain upper right and longitudinal strain lower right. Blue fields to the left display segmental values and green horseshoes in the middle display phase per segment.
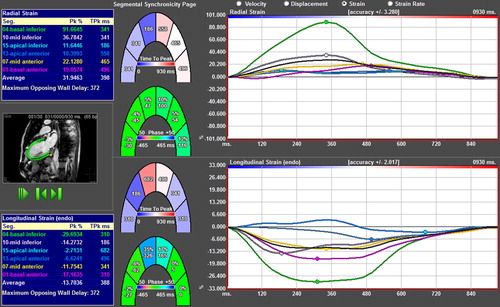
Figure 2. Principle of phase delay. The sine function is identical to the cosine function but delayed by п/2, or 25% of the cycle length.
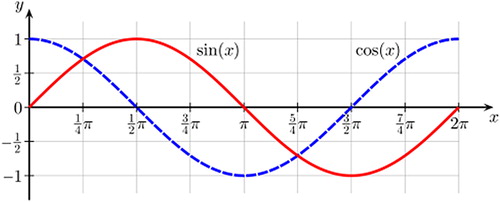
Figure 3. Enlargement of the six strain curves of the patient in (above), with their respective phase curves (below). Image courtesy of Professor Gianni Pedrizetti.
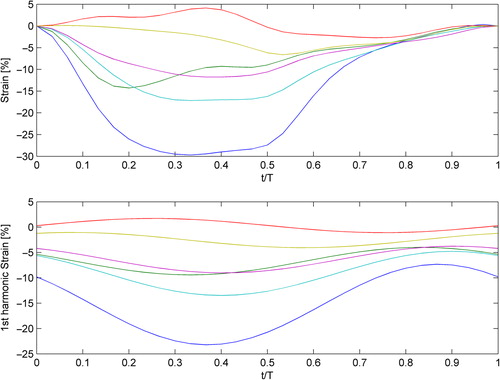
Table I. Cardiac function and scar size.
Figure 4. Graphical display of the SD of phase and TPk in patients with and without myocardial scar. Left: Phase% delay, average SD for three apical views and RSS per patient for strain (upper), velocity (middle), and displacement (lower panel). Radial measurements left, longitudinal right. Slashed bars denote scar patients and solid black bars denote patients without scar. Right: Average SD for TPk and RSS_SD-TPk for the same measurements.
Figure 5. Relationship between radial strain RSS_SD-phase% and scar volume. The correlation is y = 3.399 + 0.507*x; r = 0.660.
Figure 6. AUC for the detection of scar in a patient-based analysis using RSS_SD-phase% for radial strain (Ph_rad_strain_SD, AUC = 0.9) and radial velocity (Ph_Rad_Vel_SD, AUC = 0.968) compared with RSS_SD-TPk for radial strain (TPK_Rad_Strain_SD, AUC = 0.959) and radial velocity (TPK_Rad_Vel_SD, AUC = 0.95). There is no significant difference between the four curves, when analyzed according to DeLong.
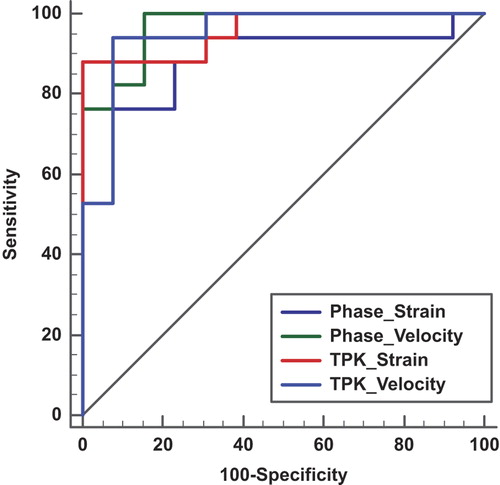
Table II. Intra- and interobserver variability from the long- and short-axis views.