
Figures & data
Figure 1. Measurement on right ventricular (RV) pressure waveform. RV systolic pressure (RVSP); RV pressure at ‘shoulder’ (RVSPs).
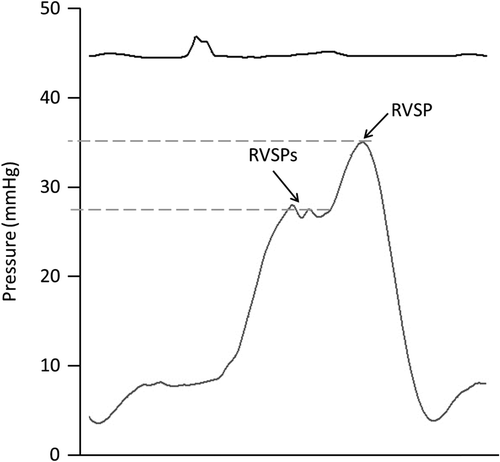
Figure 2. Matrix used to evaluate the relation between change in right ventricular wave reflection (RVWR) and change in 6 minute walk distance (6MWD). Yes means there is a positive relation, for example if RVWR decreases, 6MWD increases and vice versa. No means there is no relation.
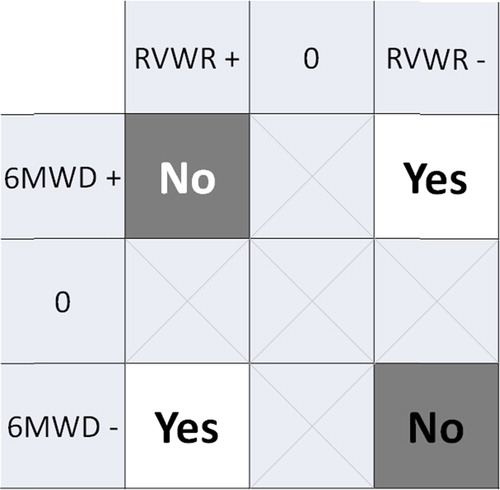
Table I. Baseline characteristics presented as median (first and third quartile) or number.
Table II. Individual changes in RV waveform reflection, walked distance and NT-proBNP.