Figures & data
Figure 1. Representative ECG and monophasic action potential recordings obtained upon an abrupt acceleration of cardiac beating rate. ECG, left ventricular (LV) epicardial (epi), LV endocardial (endo), and right ventricular (RV) epicardial monophasic action potentials (MAP) were recorded during spontaneous beating (the first beat in all panels), and upon initiation of rapid cardiac pacing. Spontaneous running cardiac cycle length was 610 ms, and the cycle length during pacing was 300 ms. Vertical dotted lines on ECG show the moments of regular stimulus (S1) application. The numbers (ms) below traces show beat-to-beat changes in QT interval and APD90 at epicardial and endocardial recording sites. Note the adaptation of ventricular repolarization to increased cardiac activation rate, as indicated by about 20 ms shortening in QT interval and APD90 over first seven paced beats, compared to the values determined prior to S1-S1 stimulation.
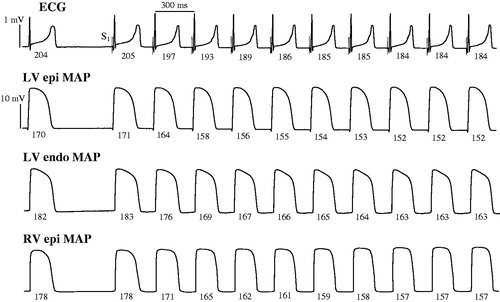
Figure 2. Rate adaptation plots of the QT interval and ventricular action potential duration determined at baseline and upon flecainide infusion. A train of 100 regular pulses at S1-S1 interval of 300 ms (total stimulation time is 30 s) was applied at LV epicardium, and QT interval (panel A), and action potential duration (APD90) determined at LV epicardium (panel B), LV endocardium (panel C), and RV epicardium (panel D) were measured in each S1 beat and plotted versus time from the beginning of stimulation. The plots obtained at baseline (squares) and upon flecainide infusion (circles) were fitted by a double-exponential function.
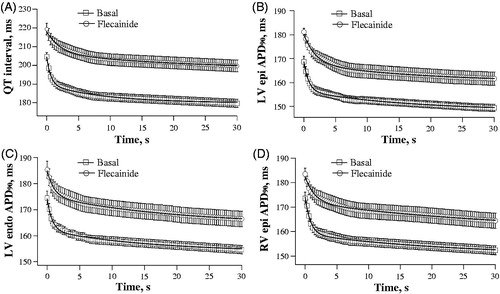
Figure 3. Effects of flecainide on the kinetics of rate adaptation of ventricular repolarization. The time constants (τ) of the fast and slow component of the adaptation of QT interval and action potential duration (APD90) to increased cardiac beating rate were determined from the double-exponential fits shown in . *p < 0.05 versus corresponding basal value.
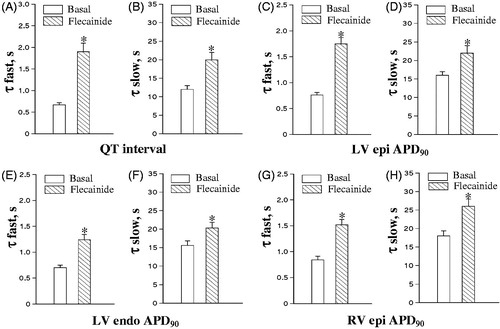
Figure 4. Extrasystolic stimulation protocol applied at variable basic drive cycle length. Left ventricular epicardial monophasic action potentials (MAP) were recorded upon programmed S1-S2 stimulations. Each MAP recording shows the last three regular (S1) beats in a basic drive train, followed by extrasystolic (S2) beat evoked at S1-S2 coupling stimulation intervals of 500 ms (panel A), 400 ms (panel B), and 260 ms (panel C). The moments of regular and extrasystolic stimulations are indicated by vertical dotted lines and dashed lines, respectively. The cycle length (S1-S1 interval) used in a basic drive train was 550 ms (upper fragment in each panel) and 300 ms (lower fragment in each panel). The numbers (ms) above MAP recordings indicate action potential duration at 90% repolarization (APD90) in regular and extrasystolic beats. Note that APD90 in regular beats is longer while pacing at S1-S1 cycle length of 550 ms as compared to 300 ms. Also note that at comparable S1-S2 coupling stimulation intervals, APD90 in extrasystolic beat is greater when S2 is applied after a train of pulses with S1-S1=550 mss, as compared to stimulations at S1-S1=300 ms.
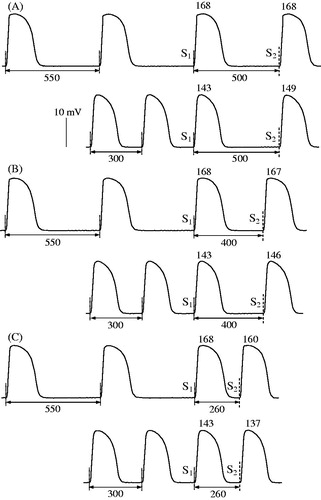
Figure 5. Basal relationships between action potential duration and S1-S2 coupling stimulation interval in extrasystolic beats. Left ventricular (LV) epicardial (epi), right ventricular (RV) epicardial, and LV endocardial (endo) APD90 were determined in extrasystolic beats evoked over a wide range of S1-S2 coupling stimulation intervals, while using the basic drive cycle length (S1-S1) of 300 ms and 550 ms.
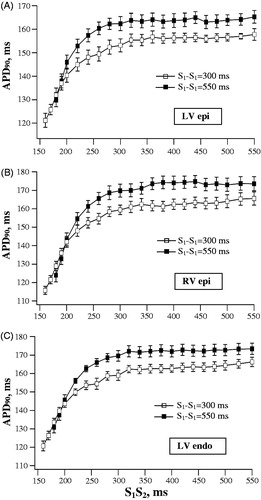
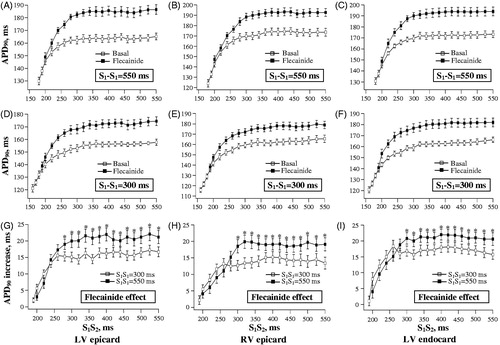
Figure 6. Effects of flecainide on action potential duration in extrasystolic beats. The data are presented as described in the legend for . Flecainide effects on APD90 in extrasystolic beats were assessed while using the basic drive cycle length of 550 ms (panels A, B and C) and 300 ms (panels D, E and F), as illustrated by the stimulation protocol shown in . The relative increase in extrasystolic APD90 value by flecainide was determined at each S1-S2 stimulation interval, and plotted separately in panels G, H and I. *p < 0.05 versus corresponding basal value (in panels G, H and I).