Figures & data
Figure 1. Experimental protocol A for the measurements of infarct size and apoptosis. Protocol B for the detection of protein phosphorylation. I/R: ischemia/reperfusion; SC: sham control; Y: young; MAC: minimum alveolar concentration; 1 MAC: 1 MAC sevoflurane postconditioning; 2 MAC: 2 MAC sevoflurane postconditioning; O: old.
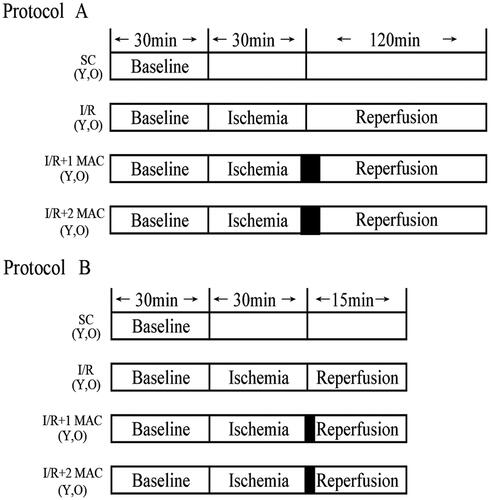
Table 1. AAR/LV for all groups.
Table 2. Hemodynamics.
Figure 2. Histogram of myocardial infarct size expressed as the percentage of the area at risk. Data were shown as mean ± SD (n = 6/group). AAR: area at risk; YC: young control; Y 1 MAC: young 1 MAC sevoflurane postconditioning; Y 2 MAC: young 2 MAC sevoflurane postconditioning; OC: old control; O 1 MAC: old 1 MAC sevoflurane postconditioning; O 2 MAC: old 2 MAC sevoflurane postconditioning; MAC: minimum alveolar concentration. *p < 0.05 vs. YC. †p < 0.05 vs. OC, O 1 MAC or O 2 MAC.
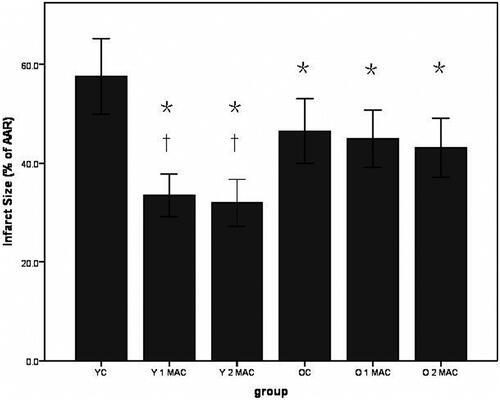
Figure 3. Representative images of TUNEL-stained apoptotic nuclei in brown and non-apoptotic nuclei in blue in different groups. In each group, six hearts were used. YC: young control; Y 1 MAC: young 1 MAC sevoflurane postconditioning; Y 2 MAC: young 2 MAC sevoflurane postconditioning; OC: old control; O 1 MAC: old 1 MAC sevoflurane postconditioning; O 2 MAC: old 2 MAC sevoflurane postconditioning; MAC: minimum alveolar concentration.
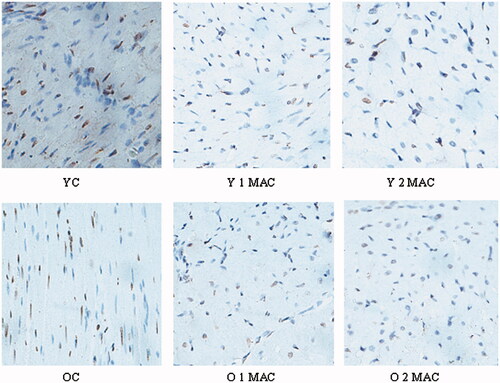
Figure 4. Quantification of apoptosis of cardiomyocyte in different groups. Apoptosis index was calculated by counting TUNEL-positive cells (magnification, ×400, 10 fields per heart) in each group, and shown as mean ± SD. YC: young control; Y 1 MAC: young 1 MAC sevoflurane postconditioning; Y 2 MAC: young 2 MAC sevoflurane postconditioning; OC: old control; O 1 MAC: old 1 MAC sevoflurane postconditioning; O 2 MAC: old 2 MAC sevoflurane postconditioning; MAC: minimum alveolar concentration. †p < 0.05 vs. YC.
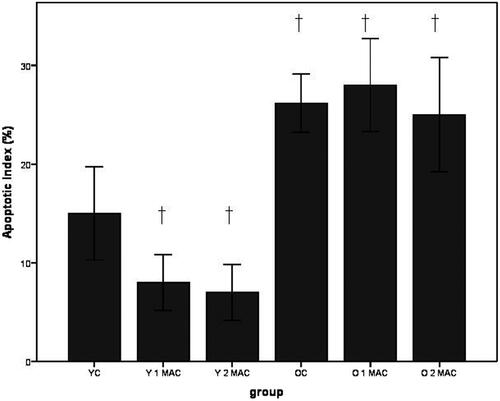
Figure 5. Phosphorylation of Akt in different groups. Data were shown as mean ± SD (n = 4/group). GAPDH was used as loading control. a.u.: arbitrary units; YSC: young sham control; YC: young control; Y: young; MAC: minimal alveolar concentration; 1 or 2 MAC: 1 or 2 MAC sevoflurane postconditioning; OSC: old sham control; OC: old control; O: old. *p < 0.05 vs. YC. †p < 0.05 vs. Y 1 MAC or Y 2 MAC. ‡p < 0.05 vs. YSC.
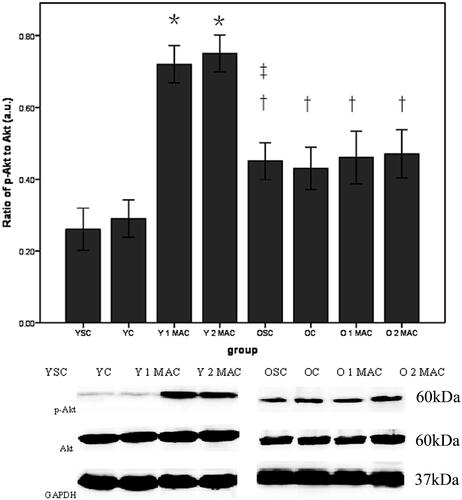
Figure 6. Phosphorylation of ERK1/2 in different groups. Data are given as mean ± SD (n = 4/group). GAPDH was used as loading control. a.u.: arbitrary units; YSC: young sham control; YC: young control; Y: young; MAC: minimal alveolar concentration; 1 or 2 MAC: 1 or 2 MAC sevoflurane postconditioning; OSC: old sham control; OC: old control; O: old. *p < 0.05 vs. YC. †p < 0.05 vs. Y 1 MAC or Y 2 MAC. ‡p < 0.05 vs. YSC.
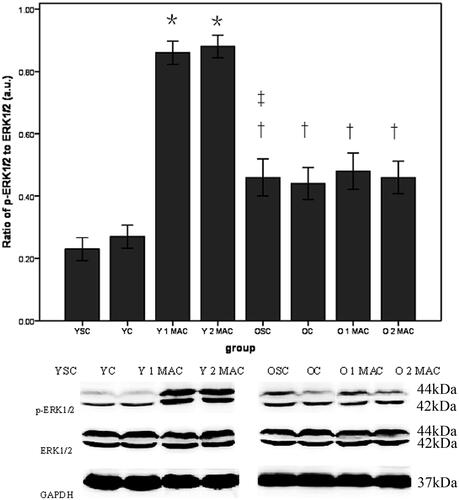
Figure 7. Phosphorylation of STAT3 in different groups. Data are given as mean ± SD (= 4/group). GAPDH was used as loading control. a.u.: arbitrary units; YSC: young sham control; YC: young control; Y: young; MAC: minimal alveolar concentration; 1 or 2 MAC: 1 or 2 MAC sevoflurane postconditioning; OSC: old sham control; OC: old control; O: old.
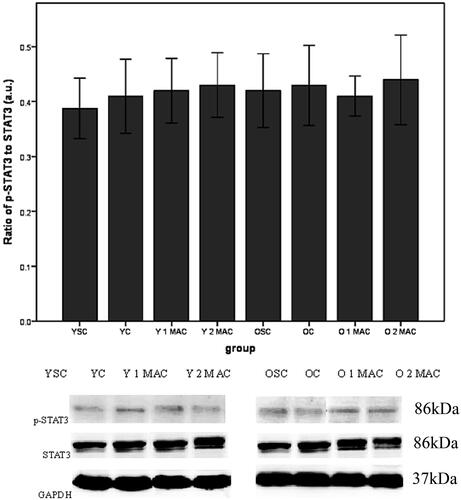
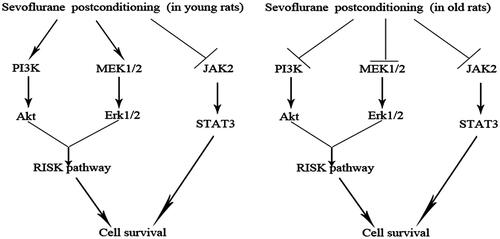
Figure 8. Diagram illustrating cardioprotective pathways of sevoflurane postconditioning in young and old rats in our model.