
Figures & data
Figure 1. J-RAPID OLE study design. The diagram depicts the breakdown of J-RAPID DB study patients into four groups for the OLE phase of the study. *Regardless of their initial DB phase group assignment, patients who achieved an ACR20 response at weeks 12 or 14 as well as at week 24 were randomized (1:1) to either CZP 200 mg Q2W (Group III, n = 93) or CZP 400 mg Q4W (Group IV, n = 92).
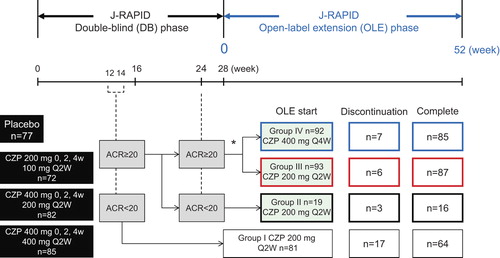
Table 1. Reasons for discontinuation of therapy.
Table 2. Patient demographics and disease status at J-RAPID pre-study baseline (FAS population).
Figure 2. The ACR20/ACR50/ACR70 response rates in patients from each treatment group. The percentages of patients in Groups I (n = 81), II (n = 19), III (n = 93), IV (n = 92) and patients in Groups II + III+ IV combined (DB completers, n = 204) who achieved an (a) ACR20, (b) ACR50, or (c) ACR70 response were plotted over time for the DB and the OLE phase of the study (FAS population, LOCF imputation). Of note, week 0 of the OLE phase of Group I (early escape) corresponds to week 16 of the DB phase. There are no points in the missing section of the graph for Group I.
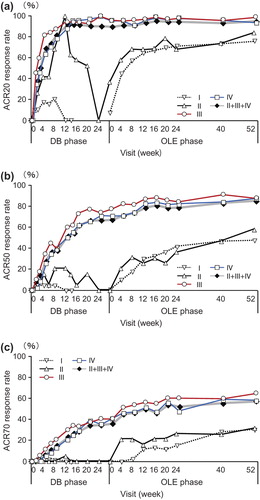
Figure 3. The changes of DAS28-ESR and HAQ-DI over J-RAPID pre-study baseline in patients from each treatment group. Changes in (a) DAS28-ESR and (b) HAQ-DI from J-RAPID pre-study baseline of Groups I (n = 81), II (n = 19), III (n = 93), IV (n = 92) and patients in Groups II + III+ IV combined (DB completers, n = 204) were plotted against time for the DB and the OLE phase of the study (FAS population, LOCF imputation). Of note, week 0 of the OLE phase of Group I (early escape) corresponds to week 16 of the DB phase. There are no points in the missing section of the graph for Group I.
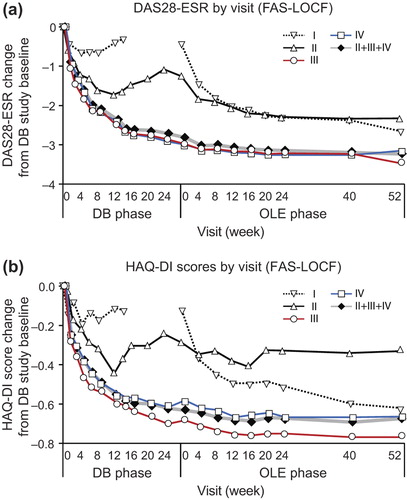
Figure 4. Inhibition of progression of structural damage: cumulative probability plot representing the change from OLE study entry in mTSS at week 52 (FAS population, linear extrapolation). The graph depicts the cumulative probability of patients displaying a particular change in mTSS from OLE study entry in Groups I (n = 67), II (n = 16), III (n = 87), IV (n = 83) and patients in Groups II + III+ IV combined (DB completers, n = 186).
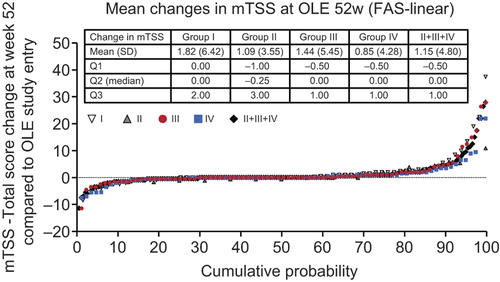
Figure 5. Post-hoc analysis of ACR20/ACR50/ACR70 response rates in patients from Groups II, III and IV excluding those who were in the placebo group during the DB phase (CZP-DB completers). The ACR20, ACR50 and ACR70 response rates of post-hoc analysis patients treated with (a) 100 mg (n = 51), (b) 200 mg (n = 63) or (c) 400 mg (n = 65) of CZP during the DB phase were plotted against time for the DB and the OLE phase of the study (LOCF imputation).
Figure 6. Post-hoc analysis of changes in (a) DAS28-ESR and (b) HAQ-DI scores from J-RAPID pre-study baseline in patients from Groups II, III and IV excluding those who were in the placebo group during the DB phase (CZP-DB completers). The changes of DAS28-ESR and HAQ-DI scores of post-hoc analysis patients treated with 100 mg (n = 51), 200 mg (n = 63) or 400 mg (n = 65) of CZP during the DB phase were plotted against time for the DB and the OLE phase of the study (LOCF imputation).
Figure 7. Post-hoc analysis of disease activity states in patients from Groups II, III and IV excluding those who were in the placebo group during the DB phase (CZP-DB completers). The proportions of patients with high (defined as DAS28-ESR > 5.1), moderate (> 3.2 and ≤ 5.1), low (≤ 3.2), or remission (< 2.6) disease activity states at DB week 0 (DB0), DB week 24 (DB24), OLE week 0 (OLE0), OLE week 24 (OLE24) and OLE week 52 (OLE52) among patients treated with (a) 100 mg (n = 51), (b) 200 mg (n = 63) and (c) 400 mg (n = 65) during the DB phase are shown (LOCF imputation).
Table 3. Treatment-emergent adverse events.