Figures & data
Table 1. Baseline characteristics of patients which are divided according to platelet count, hemoglobin level or ΔTSS.
Table 2. CDAI at baseline and after treatment of patients which are divided according to platelet count, hemoglobin level or ΔTSS.
Table 3. Changes in DAS28-ESR and CDAI from baseline of patients which were divided according to platelet count, hemoglobin level or ΔTSS.
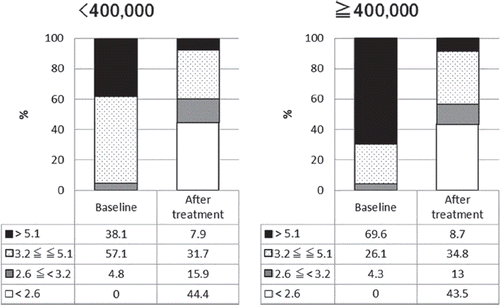
Figure 1. Proportion of patients in each disease activity (patients divided according to platelet count). Figure in left represents the result of patients with high platelet counts in baseline (< 400 000). Figure in right represents the result of patients with normal platelet counts in baseline (≦ 400 000). Numbers in the table below each bar charts represent percentage of patients in each disease activity. Patients are graded into four group according to DAS28-ESR, DAS28-ESR > 5.1, 3.2 ≦ DAS28-ESR ≦ 5.1, 2.6 ≦ DAS28-ESR < 3.2, DAS28-ESR < 2.6. Percentages of patients with each state of disease activity after the treatment is significantly changed form before the treatment (P < 0.0001).

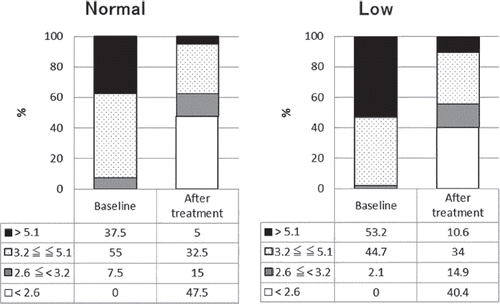
Figure 2. Proportion of patients in each disease activity (patients divided according to hemoglobin level). Figure in left represents the result of patients with normal hemoglobin level in baseline. Figure in right represents the result of patients with low hemoglobin level in baseline. Numbers in the table below each bar charts represent percentage of patients in each disease activity. Patients are graded into four group according to DAS28-ESR, DAS28-ESR > 5.1, 3.2 ≦ DAS28-ESR ≦ 5.1, 2.6 ≦ DAS28-ESR < 3.2, DAS28-ESR < 2.6. Percentages of patients with each state of disease activity after the treatment is significantly changed form before the treatment (P < 0.0001).

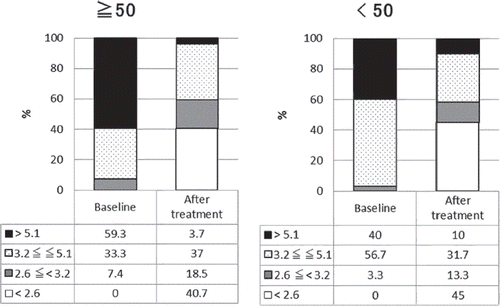
Figure 3. Proportion of patients in each disease activity (patients divided according to ΔTSS). Figure in left represents the result of patients with rapid progression in bone destruction in baseline (ΔTSS ≧ 50). Figure in right represents the result of patients with slow progression in bone destruction in baseline (ΔTSS < 50). Numbers in the table below each bar charts represent percentage of patients in each disease activity. Patients are graded into four groups according to DAS28-ESR, DAS28-ESR > 5.1, 3.2 ≦ DAS28-ESR ≦ 5.1, 2.6 ≦ DAS28-ESR < 3.2, DAS28-ESR < 2.6. Percentages of patients with each state of disease activity after the treatment is significantly changed form before the treatment (P < 0.0001).

