
Figures & data
Figure 1. Patient disposition through 156 weeks. AE, adverse event.
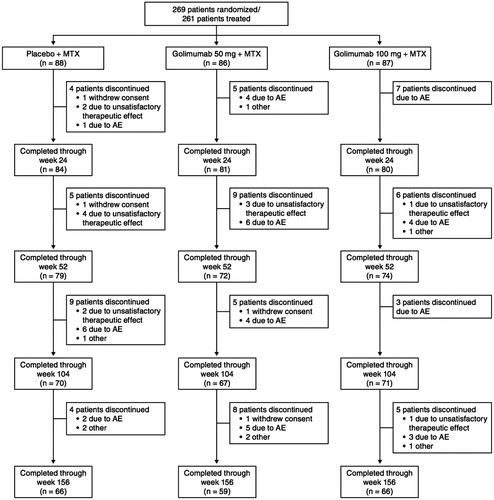
Figure 2. The proportions of patients* with an ACR20 (A), ACR50 (B), and ACR70 (C) response through week 156. *Observed data without imputation. ACR20/50/70, ≥ 20%/50%/70% improvement in American College of Rheumatology criteria; MTX, methotrexate.
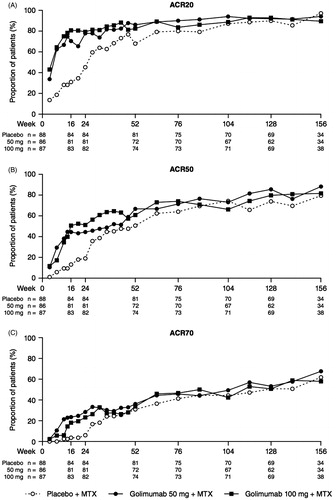
Figure 3. The proportions of patients* with remission as defined by the CDAI (A), SDAI (B), and Boolean (C) criteria through week 156. *Observed data without imputation. CDAI, clinical disease activity index; MTX, methotrexate; SDAI, simplified disease activity index.
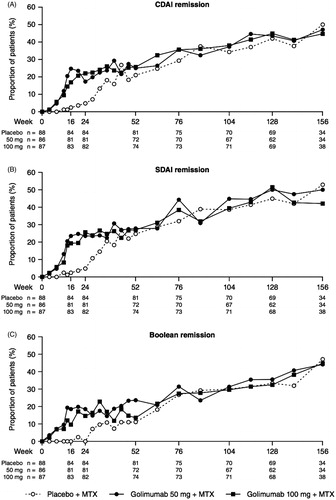
Table 1. Clinical efficacy results at weeks 52, 104, and 156.
Table 2. Radiographic results through 156 weeks.
Table 3. Adverse events through 156 weeks.
Supplemental material